


Thursday, December 29, 2016
The Top 16 of ‘16

Here are the top 16 posts of 2016:
- Okun’s Law: Fit at 55?
- Growing Apart, Losing Trust? The Impact of Inequality on Social Capital
- Goodbye Gentle Jim: Links to Jim Gordon’s Contributions
- Global and Local Housing Markets: The View From Experts at the Dallas FED
- IMF Research on Inequality: A Primer
- Labor Mobility in the United States
- Workshop on Global Labor Markets
- Financial Globalization, Inequality and the Top 1%
- Housing in the U.S.: Affordable or Not?
- Global Housing Affordability: What Do We Know?
- Austerity and Inequality: New Evidence from the IMF
- Global House Prices: Time to Worry Again?
- Employment, Efficiency, Equity: Evolution in IMF Thought
- Top 100 in global finance: two from the IMF make the cut
- Greenspan and I: My Memories of the Maestro
- What Keeps France’s Unemployment High?
Here are the top 16 posts of 2016:
- Okun’s Law: Fit at 55?
- Growing Apart, Losing Trust? The Impact of Inequality on Social Capital
- Goodbye Gentle Jim: Links to Jim Gordon’s Contributions
- Global and Local Housing Markets: The View From Experts at the Dallas FED
- IMF Research on Inequality: A Primer
- Labor Mobility in the United States
- Workshop on Global Labor Markets
- Financial Globalization,
Posted by at 2:33 PM
Labels: Uncategorized
Saturday, December 24, 2016
Financial Information and Macroeconomic Forecasts
A new IMF working paper by Sophia Chen and Romain Ranciere studies the forecasting power of financial variables for macroeconomic variables for 62 countries between 1980 and 2013. They find that financial variables such as credit growth, stock prices and house prices have considerable predictive power for macroeconomic variables at one to four quarters horizons. A forecasting model with financial variables outperforms the World Economic Outlook (WEO) forecasts in up to 85 percent of our sample countries at the four quarters horizon. They also find that cross-country panel models produce more accurate out-of-sample forecasts than individual country models.

A new IMF working paper by Sophia Chen and Romain Ranciere studies the forecasting power of financial variables for macroeconomic variables for 62 countries between 1980 and 2013. They find that financial variables such as credit growth, stock prices and house prices have considerable predictive power for macroeconomic variables at one to four quarters horizons. A forecasting model with financial variables outperforms the World Economic Outlook (WEO) forecasts in up to 85 percent of our sample countries at the four quarters horizon.
Posted by at 12:34 PM
Labels: Forecasting Forum
Thursday, December 22, 2016
Bolivia’s Gains from the 2000s Gas Boom
From an IMF report:
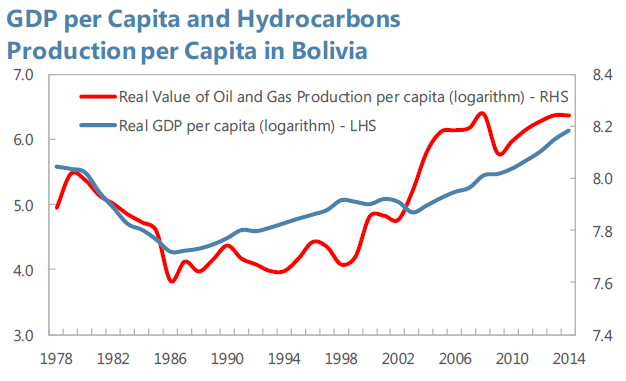
There exists a strong positive long-run relationship between real GDP per capita and the real value of hydrocarbons production in Latin American and Caribbean (LAC) oil and gas producers. Panel co-integration analysis for the period 1980–2014 suggests that a 100 percent increase in the value of oil and gas production increases the level of GDP by 14 percent on average. The relationship is particularly pronounced in Trinidad and Tobago and Venezuela while for Bolivia it is close to the LAC average. Between 2000 and 2014, the real value of oil and gas production per capita in Bolivia increased by about 370 percent, while real GDP per capita increased by 43 percent. The developments in Bolivia over the recent boom period are thus very close to what one would have expected based on this general relationship.
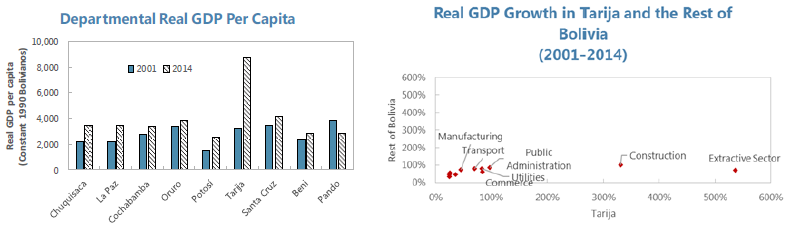
At the provincial level in Bolivia, real GDP per capita in the main gas producing region (Tarija), increased nearly 150 percent during the boom in the 2000s. The huge gas fields discovered in Bolivia in the late 1990s are located in the southern province of Tarija, which now produces about 70 percent of all Bolivian gas. The massive growth in the extractive sector and the related fiscal windfall (with Tarija receiving more revenues than all other 8 provinces combined in 2014) does not seem to have produced important spillovers to other sectors. The only sector besides the oil and gas one which grew substantially more in Tarija than in the rest of Bolivia was construction.
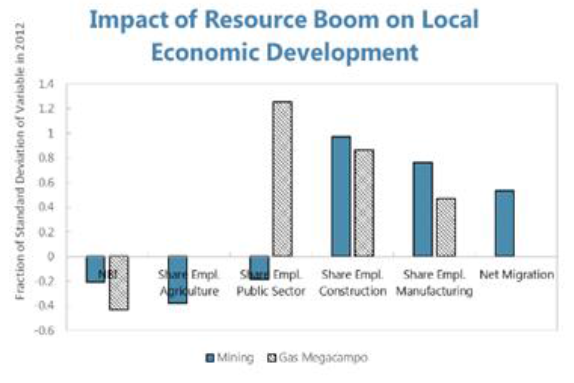
The gas boom and associated fiscal windfall reduced poverty in producing municipalities. Data from the 2001 and 2012 population censuses indicates that the large gas discoveries were associated with significant reductions in poverty of around 10 percentage points (as measured by population without access to basic necessities) in directly affected municipalities. Gas producing municipalities also experienced a very large increase in public sector employment (more than 1 standard deviation) as well as important increases in construction and manufacturing employment. In municipalities with mining—which is more labor intensive but generated a smaller fiscal windfall—a larger reallocation of labor away from agriculture, a positive migration effect, but a smaller reduction in poverty was observed.
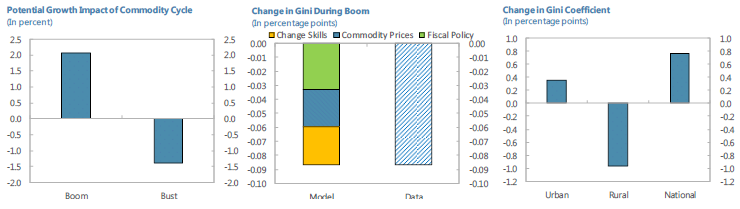
A DSGE model calibrated for Bolivia shows consistent results.
Commodity Boom:
The 2 percent increase in potential growth observed during the period 2006–14 (chart) is explained mostly by the commodity price boom increasing profitability in the energy and agricultural sectors, and government revenues. This allowed for more infrastructure investment, improving private sector productivity. The increase in the urban labor supply due to rural to urban migration and the substantial increase in the fraction of skilled individuals in this urban labor force helped the industrial sector to expand and take advantage of the increased private sector productivity.
In terms of distributional implications, the increase in the urban labor supply and its average skill level led to higher incomes in urban areas. These factors also reduced the skills premium, accounting for about 1/3 of the observed decline in inequality (chart). In addition, higher agricultural demand and a larger increase in productivity in agriculture (the sector with lower initial average productivity) reduces inter-sectoral inequality with the urban sector. This accounts for another 1/3 of the observed decrease in inequality. Higher government revenues allowed for a substantial expansion in social programs, which account for the remainder of the observed decline in inequality.
Commodity Bust
Model simulations suggest that the bust could reduce mediumterm potential growth by about 1½ percentage points. The forces at play are somewhat symmetric to the boom. First, the direct impact of lower commodity prices accounts for slightly more than half of the expected decline, with the rest explained by a combination of general equilibrium effects. Policies that increase fiscal space to support infrastructure investment and enhance the efficiency of such investment can halve the impact of the bust on growth.
Regarding the distributional implications, lower agricultural export prices affect large farmers more than smaller ones, and hence reduces the rural Gini. The urban Gini increases as private sector wages decline more than public sector ones, and civil servants are relatively well paid. The national Gini also rises given the increase in inter-sectoral inequality (chart). The economic slowdown triggered by the bust in energy and commodity prices also lowers incomes across the board. This reduces the pace of poverty reduction. Better targeting cash-transfers can go a long way to mitigate inequality this impact.
From an IMF report:
There exists a strong positive long-run relationship between real GDP per capita and the real value of hydrocarbons production in Latin American and Caribbean (LAC) oil and gas producers. Panel co-integration analysis for the period 1980–2014 suggests that a 100 percent increase in the value of oil and gas production increases the level of GDP by 14 percent on average. The relationship is particularly pronounced in Trinidad and Tobago and Venezuela while for Bolivia it is close to the LAC average.
Posted by at 6:03 PM
Labels: Energy & Climate Change
Monetary Policy and Inequality
Do the actions of central banks affect inequality? Leading central bankers have been discussing the issue (e.g., Yellen 2014; Bernanke 2015, Draghi 2016) but there is little consensus about the sign and magnitude of the effect. Our new paper documents how monetary policy affects income inequality in 32 advanced economies and emerging market countries over the period of 1990-2013. We find that decline of 100 basis points in the policy interest rate lowers inequality by about 1¼ percent in the short term and by about 2¼ percent in the medium term. The effect is significant and holds for different measures of inequality (Gini coefficient, top income shares and labor share of income). To identify the causal effect of monetary policy shocks on inequality, we borrow from the recent literature on fiscal policy (Auerbach and Gorodnichenko 2013) and construct unexpected changes in policy rates that are orthogonal to innovations in economic activity.
Do the actions of central banks affect inequality? Leading central bankers have been discussing the issue (e.g., Yellen 2014; Bernanke 2015, Draghi 2016) but there is little consensus about the sign and magnitude of the effect. Our new paper documents how monetary policy affects income inequality in 32 advanced economies and emerging market countries over the period of 1990-2013. We find that decline of 100 basis points in the policy interest rate lowers inequality by about 1¼ percent in the short term and by about 2¼ percent in the medium term.
Posted by at 4:55 PM
Labels: Inclusive Growth
Wednesday, December 21, 2016
The Fed and the U.S. Economy: Hitting the Bull’s Eye?
Like Jim Hamilton, I like the visual device suggested by my friend and former colleague Charlie Evans (a.k.a. President Evans of the Chicago Fed) of using a bull’s eye to show where the economy is relative to the Fed’s likely targets. Jim’s latest update shows the U.S. economy moving back towards the bull’s eye.
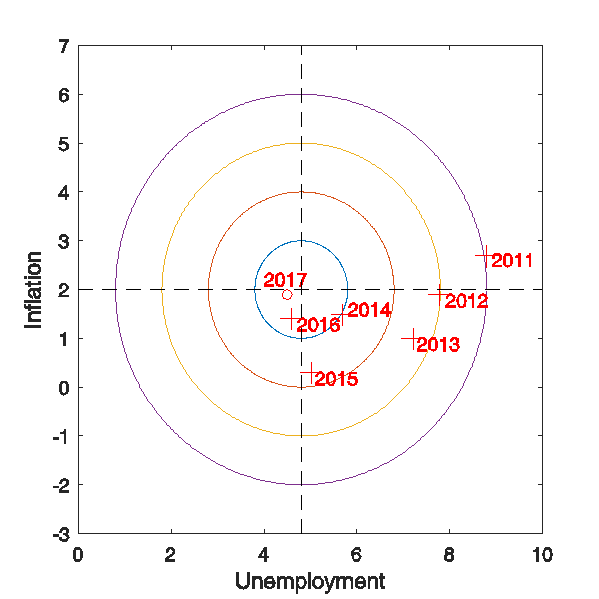
Like Jim Hamilton, I like the visual device suggested by my friend and former colleague Charlie Evans (a.k.a. President Evans of the Chicago Fed) of using a bull’s eye to show where the economy is relative to the Fed’s likely targets. Jim’s latest update shows the U.S. economy moving back towards the bull’s eye.
Posted by at 7:26 AM
Labels: Macro Demystified
Subscribe to: Posts