


Friday, September 21, 2012
House Prices in Korea
“Housing prices have peaked in Seoul but are rising in the rest of Korea,” according to a new report from the IMF. The report says that “following a protracted period of rising prices, housing prices in Seoul have remained weak due to a still large, albeit declining, inventory of unsold homes and limited expectation of price appreciation. The steady rise in housing prices outside Seoul (which have moderated recently) has been supported by contracting supply, a rapid increase in rents, and a rise in demand supported by strong non-bank lending. In response to the weakness in the Seoul housing market, the authorities have relaxed regulations in May 2012, including by raising loan-to-value (LTV) and debt-to-income (DTI) ratios applied to some high-house price districts.”
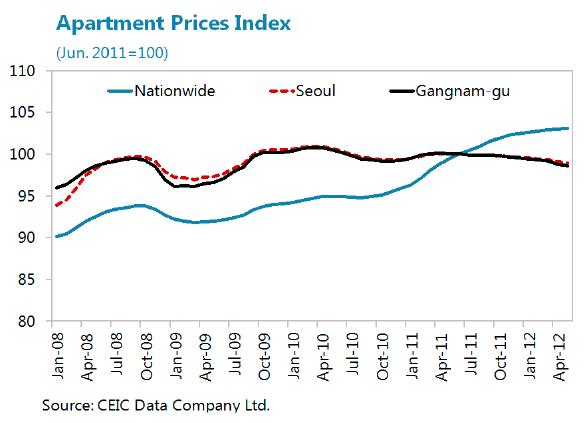
“Housing prices have peaked in Seoul but are rising in the rest of Korea,” according to a new report from the IMF. The report says that “following a protracted period of rising prices, housing prices in Seoul have remained weak due to a still large, albeit declining, inventory of unsold homes and limited expectation of price appreciation. The steady rise in housing prices outside Seoul (which have moderated recently) has been supported by contracting supply, a rapid increase in rents, and a rise in demand supported by strong non-bank lending.
Posted by at 1:46 PM
Labels: Global Housing Watch
Monday, September 17, 2012
Global House Prices Still Showing Down Trend
- Prices still falling in roughly half of 54 countries tracked around world
- Brazil, Germany among countries seeing house prices rise
- Within United States, housing picture varies considerably
Price trends vary widely between countries, with Ireland, Greece, Portugal, and Spain seeing the biggest falls in the past year and Brazil and Germany, substantial increases.
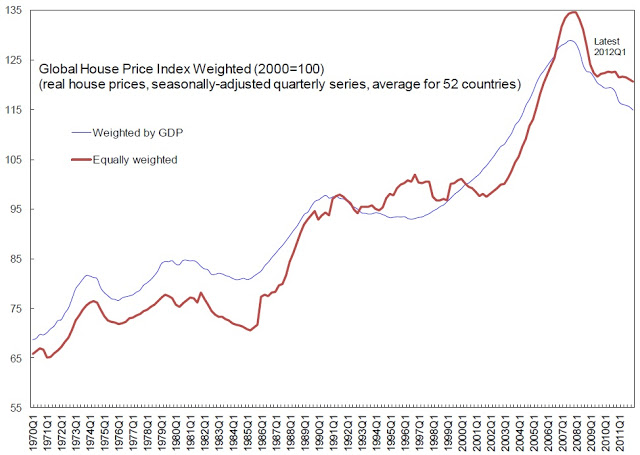
While overall the trend is mixed, there is no sign of an uptick in the global index of house prices, a weighted average of prices in 54 countries, according to our research. The index remained level during the second quarter of 2012—the latest quarter for which consistent data is available for a large group of countries—and the GDP-weighted index continued to decline. Continue reading here.
- Prices still falling in roughly half of 54 countries tracked around world
- Brazil, Germany among countries seeing house prices rise
- Within United States, housing picture varies considerably
House prices in the United States have started to pick up a little recently, but globally prices are still on a down trend, according to research by the International Monetary Fund (IMF).
Price trends vary widely between countries, Read the full article…
Posted by at 8:43 PM
Labels: Global Housing Watch
Thursday, September 13, 2012
The Construction Sector: Reeling or Rolling?
sector is looking optimistic. In 2012, total construction spending is expected
to grow by 3 to 9 percent. And the future looks even brighter; total
construction is expected to go up by 6 to 10 percent per year in 2013-2017.
September 6, Ken Simonson, Chief Economist of the Associated General
Contractors, gave a presentation on the economic outlook for construction at an
event hosted by the National Economist Club.
construction sector? Simonson said that office, retail, and lodging
constructions are up due to remodeling. In addition, the production of shale
gas (67 percent increase in 2007-10), and the expansion of the Panama Canal are
driving new activity. Shale gas has both direct and indirect impacts on
construction. For example, the direct impacts include the construction of
access road, site preparation, storage pond, support structures, and pipes for
each well. The indirect impacts include local spending by drilling firms,
workers, royalty holders, among others.
construction in the United States? The expansion of the Panama Canal will
require an upgrade of the ports in the United States to accommodate larger
ships. The upgrade of ports includes investing
in dredging, piers, cranes, and access road. The upgrade will also lead to
possible bridge, tunnel, and highway improvements, resulting in possible
changes in inland distribution and manufacturing. Overall, private
nonresidential and residential spending are leading the way forward for the
construction sector.
According to Simonson, apartments and multi-family housing should boom. On
the other hand, single family housing is growing, but with an uncertain future.
He noted that the apartment vacancy rate is now at a 10-year low and rents are
high.
sector? “Construction added 0 jobs in 2 years, but unemployment is down,”
said Simonson. Basically, workers are leaving for other sectors, going back to school,
and retiring. Simonson presented a chart that showed the change in construction
employment by state in the United States. The map was half or less in green,
meaning jobs available, and half or more in red.
The economic outlook for the construction
sector is looking optimistic. In 2012, total construction spending is expected
to grow by 3 to 9 percent. And the future looks even brighter; total
construction is expected to go up by 6 to 10 percent per year in 2013-2017.
On
September 6, Ken Simonson, Chief Economist of the Associated General
Contractors, gave a presentation on the economic outlook for construction at an
event hosted by the National Economist Club. Read the full article…
Posted by at 3:34 PM
Labels: Forecasting Forum, Global Housing Watch
Monday, September 10, 2012
House Prices in Ireland
The new IMF report on Ireland says that “the correction in house prices, one of the largest in recent history, has continued. The decline in nominal residential property prices slowed to 14.4 percent y/y in June 2012. The index has halved since its peak in 2007, eclipsing recent U.K. and U.S. house price declines and comparable to the Japanese and Nordic experiences of the 1990s. As yet, clear signs of stabilization are limited to Dublin house prices (excluding apartments), which, after dropping by 55 percent, have been flat in H1 2012. Rural areas, in contrast, still show signs of oversupply.”
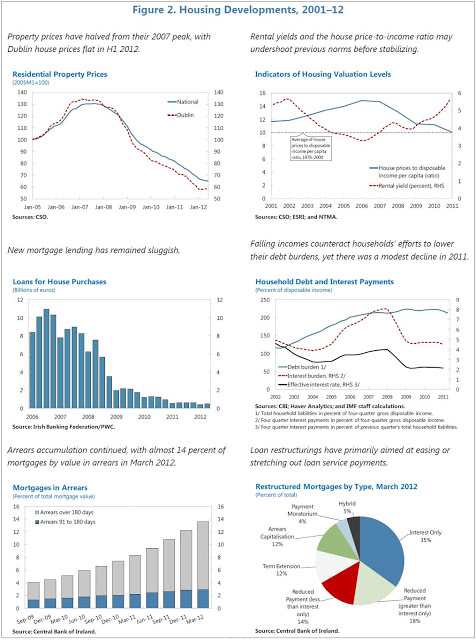
The new IMF report on Ireland says that “the correction in house prices, one of the largest in recent history, has continued. The decline in nominal residential property prices slowed to 14.4 percent y/y in June 2012. The index has halved since its peak in 2007, eclipsing recent U.K. and U.S. house price declines and comparable to the Japanese and Nordic experiences of the 1990s. As yet, clear signs of stabilization are limited to Dublin house prices (excluding apartments), which, after dropping by 55 percent,
Posted by at 4:51 PM
Labels: Global Housing Watch
Monday, September 3, 2012
Global House Price Watch

Roller Coaster
weighted average of price in 52 countries—shows no sign of an uptick. The
equally-weighted index moved sideways during the first quarter of 2012 and the
GDP-weighted index continued to decline (see Chart 1).
Chart 1. Global House Price Index
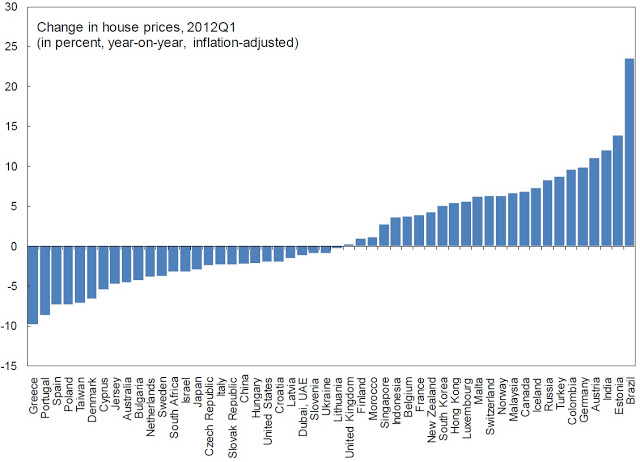
The global index continued to
mask very different developments across countries. House prices have fallen
over the past year in just over half of the countries and risen in the rest, in
Asian countries in particular (see Chart 2).
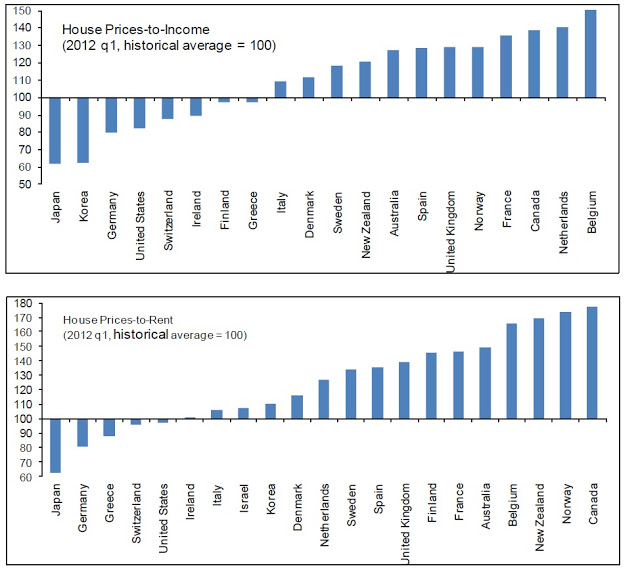
income and the ratio of house prices to rents are two indicators that give a
sense whether prices are likely to decline or rise. The price to income ratio
is the basic affordability measure for housing in a given area and the price to
rent ratio compares the total costs of homeownership vs. the cost of renting a
similar property. If these ratios are above their historical averages, economic
theory suggests that the house prices may decline in the future. The latest
data shows that both ratios continue to remain above—and in many cases well
above—their historical averages, signaling that there may potential for
corrections still to come (see Chart 3).
Relative to Incomes & Rents:
With Historical Averages
determinants of house prices, used in the working paper by Igan and Loungani explains
house price growth based on several short-run factors, such as growth in
incomes, asset prices, and population, and long-run-factors, such as the ratio
of house prices to incomes. The difference between house prices and those
predicted on the basis of these fundamental factors gives another indication of
whether prices may have more room to fall.
exercise show that in many countries the declines in house prices over the past
five years (the ‘actual’) are close to, or even exceed, what was predicted by
the model. But for many countries, house prices are still resisting the
predictions of the model (see Chart 4).
Chart 4. House Prices Changes Compared With Predictions from an Econometric Model

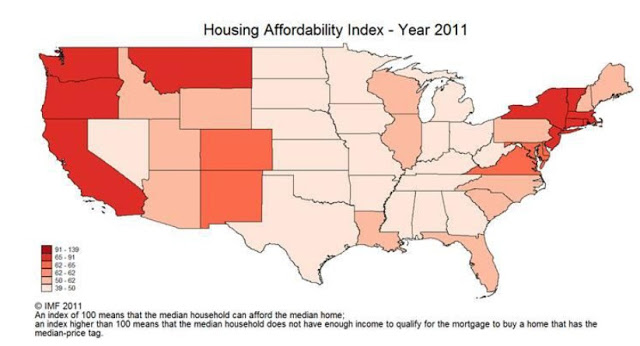
the United States
years, housing affordability improved in most U.S. states last year. In most
U.S. states, a family making the median income for the state could afford the
median house (Chart 5). There were still a few states, along the coasts, where
the median house still remained out of reach of the median household. A similar
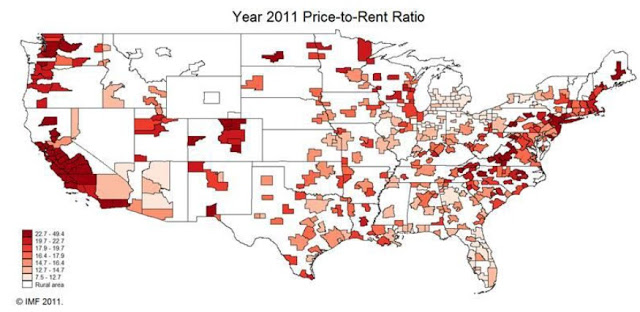
picture emerges when looking at price-to-rent ratios by metropolitan areas:
house prices remained out of line with rents in some areas along the coasts
(see Chart 6).
studies
monitoring of economic conditions in countries (the so-called “Article IV”
reports), the IMF staff often provides an assessment of conditions in the
housing markets. Readers are encouraged to complement the broad-brush analysis
in this document with the country-focused assessment provided in those reports.
A list of some of the countries for which housing markets were described in
recent reports is given below.
|
Housing Markets in Recent IMF Staff Reports
|
Date of Report
|
|
|
Link to:
|
||
|
Discussion of housing markets
|
Full report (pages on which housing is discussed)
|
|
|
Germany
|
Jul-12
|
|
|
Mar-12
|
||
|
Feb-12
|
||
|
Feb-12
|
||
|
Mar-12
|
||
|
Aug-12
|
||
|
Jun-12
|
||
|
May-12
|
||
|
Aug-12
|
||
This document draws on “Global Housing Cycles”, an IMF Working Paper 12/217 by Deniz Igan and Prakash Loungani (http://www.imf.org/external/pubs/cat/longres.aspx?sk=26229.0). It updates a few of the charts from that paper. As with Working Papers, the views expressed in this document are those of the authors and do not necessarily represent those of the IMF or IMF policy.
The Global House Price
Roller Coaster
Our global index of house prices—a
weighted average of price in 52 countries—shows no sign of an uptick. Read the full article…
Posted by at 11:22 AM
Labels: Global Housing Watch
Subscribe to: Posts