


Tuesday, June 26, 2012
2011: “Anything but a boring year” in the energy market
The energy market in 2011 was characterized by disruptions and continuity. Political unrest and violence caused outages in oil and gas production in parts of the Arab world. On the other hand, the world economy benefited from an exceptional swing in European weather, the first release of strategic petroleum reserves since 2005 and an increase in OPEC production.
Christof Rühl, Group Chief Economist of BP spoke to the Fund staff on June 14.
 |
| Photo: Michael Spilotro/IMF |
Last year, the Arab Spring caused significant interruption in the production and supply of oil. For example, the cessation of Libyan oil exports alone removed 1.2 millions of barrels per day of crude oil for the year. Moreover, in April, the earthquake in Japan damaged the Fukushima nuclear reactor which led to closures of nuclear plants in Japan and Europe. This resulted in losses of 43 millions of tons of oil equivalent, which is more than 11 percent of the European oil consumption. In 2011, average annual Brent prices increased by 40% to reach $111 per barrel. On a related note, huge floods in Australia impaired coal production.
So, with all the chaos, how did the energy market remain resilient? There was the first release of strategic petroleum reserves since 2005. There was a petroleum sale of 30 million barrels non emergency to offset disruptions caused by political upheaval in Libya and elsewhere in the Middle East. The amount was matched by IEA countries for a total of 60 million barrels released from stockpiles around the world. Also, there was the largest increase in OPEC production since 2008 and a mild winter in Europe.
In 2011, energy consumption stayed steady in Non-OECD countries, while it declined in OECD countries. Non-OECD energy consumption stayed firm, in contrast, OECD energy consumption fell by 0.8 percent, despite average GDP growth. Energy consumption in OECD countries has declined in three out of the last four years. Why last year? First, the impact of high oil prices everywhere and of high coal and gas prices outside the US. Second, the decline was due to the impact of Fukushima nuclear disaster. And third, Europe experienced a mild winter in 2011 compared to 2010.
What was the impact of high oil prices on oil importers? The overall effect of how high oil prices affect oil importers depends on how oil exporters use the additional income generated by higher prices. This extra income can be recycled in two ways – they can spend it to purchase goods and services from oil importing countries, this will offset the high import bill in oil consuming countries or they can spend it by purchasing foreign assets which increase the global supply of savings leading to low interest rates and low borrowing costs around the world. But, with interest rates close to zero, this option loses its meaning.
 |
| Photo: Michael Spilotro/IMF |
 |
| Photo: Michael Spilotro/IMF |
 |
| Photo: Michael Spilotro/IMF |
The energy market in 2011 was characterized by disruptions and continuity. Political unrest and violence caused outages in oil and gas production in parts of the Arab world. On the other hand, the world economy benefited from an exceptional swing in European weather, the first release of strategic petroleum reserves since 2005 and an increase in OPEC production.
Christof Rühl, Group Chief Economist of BP spoke to the Fund staff on June 14.
Posted by at 5:24 PM
Labels: Energy & Climate Change
Monday, June 11, 2012
Unemployment: Cyclical or Structural?
Eric Swanson reports on the San Francisco Fed macro conference:
“Breaking down changes in output or employment into structural and cyclical components is very difficult, since these elements are not directly observable. Two papers at the conference applied cutting-edge methods to this question, providing estimates of the structural and cyclical components of the 2007–09 recession’s large employment and output declines.
Chen, Kannan, Loungani, and Trehan use differences in stock market returns across industries to help identify the magnitudes of cyclical and structural shocks to the economy … Chen and coauthors collected cross-industry stock return data from 1962 to 2011, which they use to construct an index of stock return dispersion across industries. The authors then estimate the typical response of output and employment to sudden changes in this index, providing an approximation to the effects of structural shifts on the economy. The authors find that such structural shifts account for about 25% of U.S. output and employment fluctuations since 1962. The remaining 75% is due to cyclical factors.”
Read the rest of Swanson’s excellent summary here. The Chen, Kannan, Loungani and Trehan paper is available here.
Eric Swanson reports on the San Francisco Fed macro conference:
“Breaking down changes in output or employment into structural and cyclical components is very difficult, since these elements are not directly observable. Two papers at the conference applied cutting-edge methods to this question, providing estimates of the structural and cyclical components of the 2007–09 recession’s large employment and output declines.
Chen, Kannan, Loungani, and Trehan use differences in stock market returns across industries to help identify the magnitudes of cyclical and structural shocks to the economy … Chen and coauthors collected cross-industry stock return data from 1962 to 2011,
Posted by at 6:47 PM
Labels: Inclusive Growth
Sunday, June 10, 2012
Five Reasons for Global Resilience to Oil Price Rises
Posted by at 4:47 PM
Labels: Energy & Climate Change
Friday, June 8, 2012
IMF Analyst Sees Global Slowdown Biggest Oil Worry
By John M. Biers
A big drop in oil prices due to a global economic slowdown constitutes a bigger worry than the relatively high price floor for oil that has prevailed recently period, an International Monetary Fund analyst said in an interview this week.
Oil prices have dropped roughly 20% in recent weeks amid weak jobs data and other economic indicators that have renewed fears of a global slowdown, yet remain high by historical standards, lingering around or above $100 a barrel Brent since January 2011.
In remarks that provided a view of how the IMF sees the oil market, Prakash Loungani said the global economy has adapted to a relatively high oil price floor as long as it isn’t caused by an unexpected supply disruption. But Mr. Loungani said the agency now fears a big drop in prices because it would likely be accompanied by a major global economic slowdown.
“The worry is that the economies are looking soft, both the U.S. and major emerging economies,” said Mr. Loungani, an advisor in the research department of the IMF who handles commodities research.
“We are very worried about the state of the world economy,” Mr. Loungani said in a telephone interview.
Thursday, ICE July North Sea Brent crude was 1.2%, or $1.23, higher at $101.87 a barrel. Light, sweet crude oil for July delivery was up 1.6%, or $1.34 higher, at $86.38 a barrel on the New York Mercantile Exchange.
Mr. Loungani said a relatively high oil price isn’t in itself a huge concern for the economy. The influential Saudi oil minister, Ali al-Naimi, said recently he wants oil prices around $100 a barrel. Other countries in the Organization of Petroleum Exporting Countries now also look for triple-digit oil prices, leaving the $22-$28 a barrel price band once favored by the cartel as a distant memory.
Mr. Loungani pointed to IMF research that has shown how the world has adapted to relatively high oil prices due to a number of factors. For one, much of the reason for higher oil prices rests on rising demand in emerging economies; in that case, the benefits of strong growth outweigh the negatives of higher oil prices.
Other mitigating factors to high prices include more sophisticated central bank policies that guard against oil-related inflation growth; greater efficiency in the use of energy in the economy; and greater diversification in energy supplies.
“The trends are in the direction of reduced impact” on the economy from higher oil prices, Mr. Loungani said. “The structure of the economy has adjusted.”
However, Mr. Loungani said the global economy can still be harmed by sudden price spikes if they are caused by unexpected supply disruptions, because “the economy still doesn’t have the means to handle that in the short-term.”
Some economists have highlighted the role that higher oil prices played in the global 2007-2008 slowdown related to lower disposable income. At the time, the dominant explanation for the slowdown concerned the bursting of the U.S. housing bubble and the ensuing financial crisis.
Mr. Loungani said he has been persuaded that “oil prices may have played a role” in that slowdown, but he said the current weakness relates more to lingering financial weakness and the ongoing euro zone crisis.
Write to John Biers at john.biers@dowjones.com
By John M. Biers
A big drop in oil prices due to a global economic slowdown constitutes a bigger worry than the relatively high price floor for oil that has prevailed recently period, an International Monetary Fund analyst said in an interview this week.
Oil prices have dropped roughly 20% in recent weeks amid weak jobs data and other economic indicators that have renewed fears of a global slowdown, yet remain high by historical standards,
Posted by at 2:00 AM
Labels: Uncategorized
Wednesday, June 6, 2012
Seven Questions about Income Inequality
A recent flurry of media and academic attention toward rising inequality across the world has generated a tremendous amount of research on inequality trends and their causes and consequences. While some of the hype on the topic is warranted, the large and expanding literature has made it difficult to sift out the main facts. These seven questions attempt to highlight the basic points made by the recent literature.
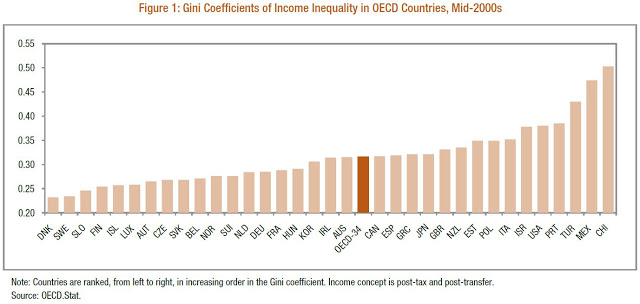
Question 1: What is the basic measurement of income inequality?
The most common way to measure inequality is the Gini coefficient, which is an index that ranges from zero to one, with a value of zero corresponding to equal incomes across all recipients and a value of one corresponding to a situation in which one household receives all of the income in the economy. As Figure 1 shows, the Gini coefficient varies substantially across countries.
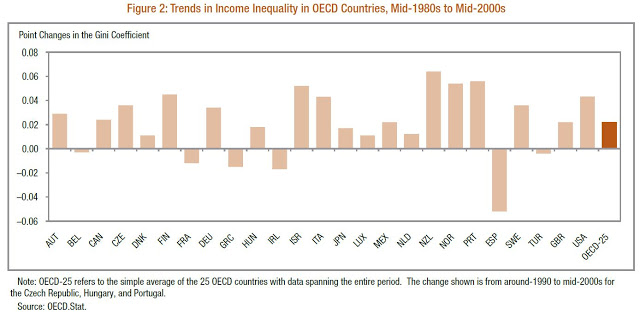
Question 2: How much has income inequality increased over the past few decades?
Question 3: What has caused this rise in income inequality?
Skilled-based technological change is thought to be one of the leading causes driving the increase in inequality in advanced economies over the past four decades. The middle class has been “hollowed out” as machines have replaced medium-skilled labor (Acemoglu and Autor, 2011). More recently, another economic change that has contributed to the decline of middle-income jobs in developed countries is the increase of globalization. As medium-skilled jobs move off-shore, the replaced workers must face a decision of increasing their education to obtain higher-paying jobs or to move to lower-paying jobs. This effect has become more prominent in the 2000s than it had been in the preceding decades (Autor, Dorn, Hansen, 2011). Two other possible contributors to the increase in income inequality are the decline of unions and the decline of the real minimum wage in many advanced economies. Historically, unions have affected the wage structure by boosting the wages of lower middle class workers (Card, 2001). In the United States, the percent of private sector workers covered by unions has decreased from more than 20 percent in the mid-1970s to less than 10 percent in 2010. At the same time, since the nominal minimum wage has not increased in step with inflation, the real minimum wage has decreased in many countries, contributing to the decline of real wages of the lowest income quintile. Furthermore, the increase of immigration and the use of illegal immigrant labor have weakened unions and the application of the minimum wage. Finally, an important factor in the rise in inequality has been the emergence of a powerful financial sector. A substantial portion of the rise in income inequality has been due to the increase in the share of income accruing to the top 1 percent of the income distribution (Atkinson, Piketty, and Saez, 2011). This rise is at least partially due to a dramatic increase in salaries in the financial sector which, in turn, can be attributed to the structure of the financial system and its associated incentives.
Question 4: What are the possible negative consequences of the rise in income inequality?
Recent research has shown that societies with high inequality tend to adopt policies that hinder long-term growth potential, due to conflicts between the holders of economic power and political power (Berg and Ostry, 2011). In addition, these societies face short-term destabilizing influences. High levels of inequality may increase the competition between income earners. Lower earners feel social pressure to borrow, if possible, in order to maintain a consumption level that approaches that of their wealthier neighbors. The overleveraging that might follow can lead to macroeconomic instability and is thought to be one of the causes of the recent recession (Rajan, 2010). The welfare considerations of high inequality extend past the effect on growth and macroeconomic stability. One broad negative consequence of a rise in inequality is an increased stratification of society. The emergence of a class society is bad for social and health outcomes as people are faced with the pressures associated with dramatically different living situations (Pickett and Wilkinson, 2009). High inequality tends to be associated with lower intergenerational mobility, implying
that these pressures and their negative consequences mayhave lasting effects on future generations (Corak, 1993).
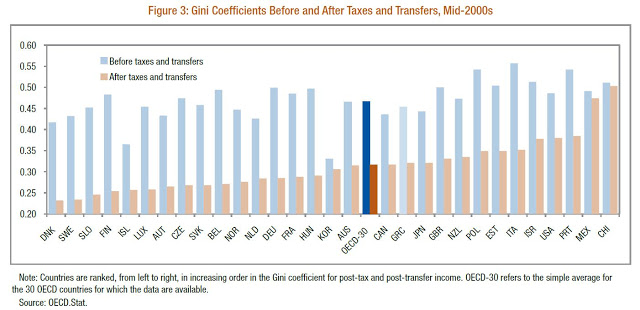
Question 5: How can governments intervene in order to stem inequality?
The most direct way for governments to intervene is to implement progressive tax and transfer policies. As Figure 3 shows, governments in OECD countries vary substantially in how successful their policies are in reducing inequality. In addition to the direct monetary redistribution programs, a government’s involvement in equalizing the access to services, such as education, health care, and technology, can have medium- to long-run success in narrowing the income distribution. Furthermore, regulation of the minimum wage and low-income labor policies can help to boost the earnings of the workers on the low end of the distribution. Lastly, the government may have a role in regulating the financial sector, as mentioned in Question 3.
Question 6: Why the focus on income inequality? Are there other measures that are more meaningful?
The focus on income inequality largely has to do with the availability of data, even while other measures may better capture welfare concerns. Income inequality may exaggerate the disparities in actual consumption; high income individuals tend to save more and consume less of their income at the same time that public provision of education, health care and other services further narrows the consumption gap between the rich and the poor. Furthermore, higher levels of consumption lead to decreasing rates of marginal utility; with this in mind, happiness inequality may be the closest measure to capturing welfare, yet is also one of the most elusive to measure (Stevenson and Wolfers, 2008). Other types of inequality measures also have their own merits: wealth disparities, differential access to services, and the spread in lifetime earnings. Some economists argue that the percentage of the population in poverty is more relevant than any measure of inequality. Ultimately, the “correct” measure depends on the specificwelfare question of interest.
Question 7: Are any of the concerns about the rise in inequality overstated?
There are potentially dramatic welfare implications surrounding the recent increases in inequality in advanced economies. However, some of the concerns highlighted in the media are almost certainly overblown. In a world in which social media makes the emergence of celebrities and mass-marketed products possible, there is more of an opportunity for superstars to amass tremendous amounts of income than there had been earlier in the twentieth century. Furthermore, as economies get richer, more workers choose to curtail their hours in exchange for more leisure; in doing so, an income gap is automatically generated between the average “threshold” worker and those who have a taste for working longer hours for a higher monetary reward (Cowen, 2011). It is questionable whether these contributions to the spread of the income distribution have either negative welfare or growth implications. While it may be difficult to distinguish a destructive rise in income inequality from a positive rise that naturally occurs as a country gets richer, it is important to keep in mind that the goal of reducing inequality is not to hurt the rich at the expense of the poor.
A recent flurry of media and academic attention toward rising inequality across the world has generated a tremendous amount of research on inequality trends and their causes and consequences. While some of the hype on the topic is warranted, the large and expanding literature has made it difficult to sift out the main facts. These seven questions attempt to highlight the basic points made by the recent literature.
Question 1: What is the basic measurement of income inequality?
Posted by at 8:18 PM
Labels: Inclusive Growth
Subscribe to: Posts