Tuesday, August 23, 2016
Global and Local Housing Markets: The View From Experts at the Dallas FED
From Global Housing Watch Newsletter: August 2016
In this issue of the Global Housing Watch newsletter, Enrique Martínez-García and Valerie Grossman spoke with Hites Ahir about their work on housing markets. Martínez-García is a senior research economist and advisor, and Grossman is a senior research analyst in the Research Department at the Federal Reserve Bank of Dallas.
Disclaimer: The views expressed in this Q&A are those of the authors and do not necessarily reflect the views of the Federal Reserve Bank of Dallas or the Federal Reserve System.

Enrique Martínez-García and Valerie Grossman
Hites Ahir: Since 2011, the Dallas Fed has been publishing data on house prices and personal disposable income across countries. Could you tell us what prompted you to look at house prices across countries and a bit about the data?
Enrique Martínez-García and Valerie Grossman: The global 2008-09 recession brought renewed interest in understanding housing and its effects on the macroeconomy, but also a growing recognition that there is an important global dimension to housing that can no longer be ignored. Early on in our own work, we realized that the lack of consistent, reliable and comparable time series across countries remained a significant limitation to tackle questions on international housing—and not just for us! Since 2011, with a lot of help at the beginning from our former colleague Adrienne Mack, we have combed through many sources and consulted housing experts from around the world. As a result of all this extensive work, we put together a balanced panel dataset of quarterly housing market indicators starting in the first quarter of 1975 for 23 countries (currently).
Our dataset is released regularly to the public at quarterly frequency through the Dallas Fed’s international house price database website to further facilitate discussion and research on global housing. The database includes corresponding indexes on personal disposable income (PDI) per capita to control for changes in the affordability of housing, and additional novel tools for monitoring housing. We also continue to develop new sources and new partnerships to broaden the database—next on our agenda for this year is the inclusion of data for Slovenia.
Hites Ahir: The Bank for International Settlements (BIS) and the Organisation for Economic Co-operation and Development (OECD) also publish data on house prices. How does the Dallas Fed’s house price dataset compare to the other two?
Enrique Martínez-García and Valerie Grossman: We view our database as opening a new window to track and investigate international housing dynamics. Other resources such as the BIS repository and its panel of long time series or the long-standing work of the OECD on house prices and house-price-to-fundamental ratios provide additional information and bring forth their own approaches. There is naturally somewhat of an overlap, so we complement each other (and in some areas we even benefit from their work). However, our data is also distinct along key dimensions that are worth highlighting.
Our emphasis, which differentiates us from the BIS and the OECD, is on the consistency, comparability and replicability across countries for empirical analysis, taking the U.S. Federal Housing Finance Agency price index as our reference benchmark. Additionally, we foster research on international housing by including PDI per capita and other unique resources like statistics summarizing key features of the time series (exuberance indicators) as well as historical vintages.
Our country sources and methodology are largely determined by these overarching goals, which explains some of the differences that arise and variation in coverage between our data and the OECD and BIS data. We provide extensive and up-to-date documentation on our general methodology and the country detail, for anyone interested in exploring the nitty-gritty of the international house price database.
Hites Ahir: There is also a dataset on Exuberance Indicators produced by the Dallas Fed. Could you explain what these indicators are?
Enrique Martínez-García and Valerie Grossman: The exuberance indicators are the result of an ongoing partnership with Efthymios Pavlidis and his colleagues in the Department of Economics at Lancaster University Management School, who separately release similar indicators for U.K. regional housing markets. We derive these indicators from the recently developed recursive unit root tests of Yale economist Peter C. B. Phillips and his co-authors called Supremum Augmented Dickey Fuller (SADF) and Generalized SADF (GSADF). We employ them to detect and date the periods of exuberance during which house prices (or conventional house-price-to-fundamentals ratios) display explosive behavior.
Exuberant or explosive price behavior may occur when house prices are not based on housing market fundamentals, so these exuberance measures provide useful information for the detection of emerging misalignments and are powerful tools for monitoring housing. Detecting such periods is important due to the fact that, historically, rapid price increases have been followed by large corrections, which have severe consequences for the real economy—the most notable example being the boom-bust episode of the 2000s.
In a 2015 paper published at The Journal of Real Estate Finance and Economics, we explore the features of the international house price database in detail, showing evidence of the unique global dimension of the episode of exuberance that preceded the global 2008-09 recession. Incidentally, we also propose in that paper a novel extension of the GSADF test to a panel setting to exploit the large cross-sectional dimension of our international data. We view this as an important step to enhance our ability to detect common episodes across multiple series.
Hites Ahir: All the datasets were updated in July and include the data for the first quarter of 2016. Looking at the data, are you seeing any common patterns across countries?
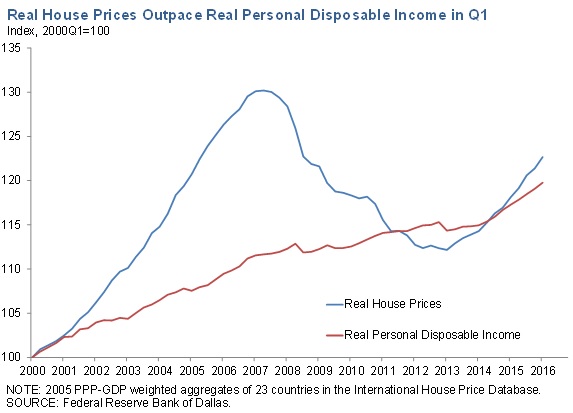
Enrique Martínez-García and Valerie Grossman: While our 23-country aggregates for both real house prices and real personal disposable income are rising, house price growth continues to outpace that of PDI per capita in the first quarter of 2016, suggesting that housing is becoming less affordable globally albeit not across all countries. The recovery of real house prices remains uneven and, as a matter of fact, we still see a number of countries below their pre-recession levels.
The exuberance statistics based on real house prices do show areas of emerging risk, meaning that several countries show multiple quarters where the indicator is above conventional critical values for detecting explosive behavior—among them most notably Switzerland and Canada. However, we would caution not to over-interpret those signs of risk. We still don’t see any major signs of a boom in the price-to-income ratios where we control for changes in the affordability of housing—so as not to treat house price movements in isolation.
Hites Ahir: In a recent article titled: Curb Your Enthusiasm: Keeping an Eye on Home Prices, you take a look at house prices in Texas. What do you find?
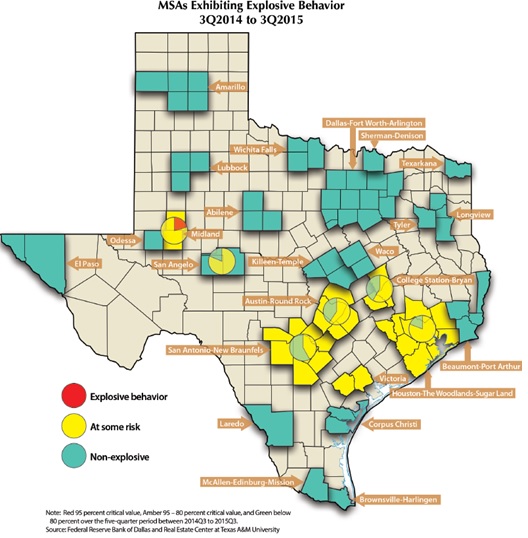
Enrique Martínez-García and Valerie Grossman: In this paper co-authored with Luis B. Torres of the Real Estate Center at Texas A&M, we apply the exuberance statistics to explore house price regional behavior for Texas and its 25 Metropolitan Statistical Areas (MSAs). At the state level, we detect two major periods of explosive behavior. The first one occurred during the late 1980s oil bust, pushing the Texas economy into a recession. House prices in the state broadly collapsed while those in the rest of the country did not. The second episode occurred in the late 1990s and early 2000s coinciding with the early stages of the housing boom in the U.S. and globally that led to the 2008-09 global recession. For the state, the episode ended much earlier than for the U.S. and many other countries, allowing Texas to avoid the worst of the housing fallout that caused so much of the damage elsewhere.
Interestingly, at the MSA level, we find that differences across regional housing markets in Texas result in varying patterns of exuberant behavior across the 25 MSAs in the state. Ripple effects from oil boom-bust periods, especially during the 1980s, and from national and global forces—like the widespread decline in long-term interest rates since the 1990s—underpin the experiences of most MSAs. However, regional and local factors also appear to play a role in the likelihood that a period of exuberance will occur. We also report that by our metric, neither Texas nor any of its 25 MSAs are currently experiencing a risk of explosive behavior in house prices.
Hites Ahir: What impact did recent oil price developments have on house prices in Texas?
Enrique Martínez-García and Valerie Grossman: Texas home prices have continued to climb even after the recent fall in oil prices. Constraints on supply in conjunction with strong demand have contributed to low home inventory levels and robust price gains. However, Texas is a more diversified economy now than in the 1980s and is less oil-dependent too. Consider two of the major MSAs in the state: Austin has a strong technology industry base, and Dallas is a leading transportation and warehousing hub. This diversification may have weakened the relationship between oil prices and overall Texas growth and, in particular, its impact on housing.
However, regional variation can be significant, as we discussed in our aforementioned article Curb Your Enthusiasm:…. We see that less oil-dependent regions, such as Dallas and Austin, continue to exhibit strong real appreciation. Among the more oil-dependent MSAs, Houston has held up relatively well as the downstream oil industry and the health care sector have mitigated the downturn in oil prices, although all signs point in the direction of further softening going forward. In upstream producing MSAs, like Midland and Odessa, house prices have suffered the brunt of the oil price fall more, already experiencing some real declines.
Motivated by this, we currently are investigating empirically how oil price shocks affect housing and land prices in a joint paper with co-authors Luis B. Torres and Yongzhi Sun from Texas A&M. We interpret the oil shocks as exogenous shifts in the disposable income of households and analyze its effects on Texas, exploiting the cross-sectional variation of its housing and land markets across MSAs. We also control explicitly for the effect of long-term interest rates in our model. Although our results are preliminary at this stage, we identify statistically significant short-run and long-run relationships between real house prices, real land prices and real oil prices that differ across more oil-income-dependent and less oil-income-dependent regions of the state. Stay tuned for more results coming soon….
Hites Ahir: Finally, are there any ongoing projects on housing markets that you would like to share with us?
Enrique Martínez-García and Valerie Grossman: We have a few projects that are work-in-progress that we’re really excited about. We’re exploring the patterns of the housing cycle and the role of aggregation (across geography, across housing types, etc.) for monitoring with Efthymios Pavlidis. We also have an ongoing project, to which we alluded before, on the dynamic role that oil shocks play on house and land prices with MSA-level data for Texas. We’re working on this with Luis B. Torres and Yongzhi Sun. Needless to say, we also continue to work on improving and expanding the international house price database.
Posted by at 5:00 AM
Labels: Global Housing Watch
Subscribe to: Posts