


Friday, March 23, 2018
Housing View – March 23, 2018
On cross-country:
- The Pursuit of Financial Stability and Tasks for Monetary, Regulatory, and Macro-Prudential Policies – IMF
- True Affordability: Critiquing the International Housing Affordability Survey – Victoria Transport Policy Institute
On the US:
- Affordable housing: Supply side innovation? – Rutgers Center for Real Estate
- Land-Use Regulations, Property Values, and Rents: Decomposing the Effects of the California Coastal Act – Federal Reserve Bank of Philadelphia
- For Low-Income Renters, the Affordable Housing Gap Persists – Citylab
- How Mortgage Companies Might Finally Be Held Accountable – The Nation
- Segregation Forever? Richard Rothstein speaks at the U.S. Department of Housing and Urban Development – Economic Policy Institute
- Mortgage Debt and Shadow Banks – De Nederlandsche Bank
- Housing as a hub for health, community services, and upward mobility – Brookings
- The Seven Sizzling Housing Markets – John Burns Real Estate Consulting
- The Next Housing Crisis: A Historic Shortage of New Homes – Wall Street Journal
- Spring may not be so hot for U.S. housing markets – Global Property Guide
- A housing recovery without homeowners – Federal Reserve Bank of St. Louis
- California Housing Problems Are Spilling Across Its Borders – New York Times
- Trump’s Tariffs Will Make Housing More Unaffordable – Reason
- Valuing urban land: Comparing the use of teardown and vacant land sales – Regional Science and Urban Economics
- Suburban Housing Costs Are Stretching Families to the Brink – Slate
- Commuting, Labor, and Housing Market Effects of Mass Transportation: Welfare and Identification – Federal Reserve Bank of Philadelphia
- How Do Funding and Review Processes Shape the Design of Affordable Housing? – Harvard Joint Center for Housing Studies
On other countries:
- [Canada] The Propagation of Regional Shocks in Housing Markets: Evidence from Oil Price Shocks in Canada – Bank of Canada
- [Iceland] Short-term renting of residential apartments Effects of Airbnb in the Icelandic housing market – Central Bank of Iceland
- [Switzerland] Swiss central bank warns of ‘correction’ in real estate – Financial Times
- [United Kingdom] Rethinking London’s ‘ripple effect’ on house prices: other UK regions transmit shocks too – London School of Economics
- [United Kingdom] Home Ownership Aspirations Survey – Cluttons

Photo by Aliis Sinisalu
On cross-country:
- The Pursuit of Financial Stability and Tasks for Monetary, Regulatory, and Macro-Prudential Policies – IMF
- True Affordability: Critiquing the International Housing Affordability Survey – Victoria Transport Policy Institute
On the US:
- Affordable housing: Supply side innovation? – Rutgers Center for Real Estate
- Land-Use Regulations, Property Values, and Rents: Decomposing the Effects of the California Coastal Act – Federal Reserve Bank of Philadelphia
- For Low-Income Renters,
Posted by at 5:00 AM
Labels: Global Housing Watch
Thursday, March 22, 2018
How much people make
From the US Congressional Budget Office (CBO):
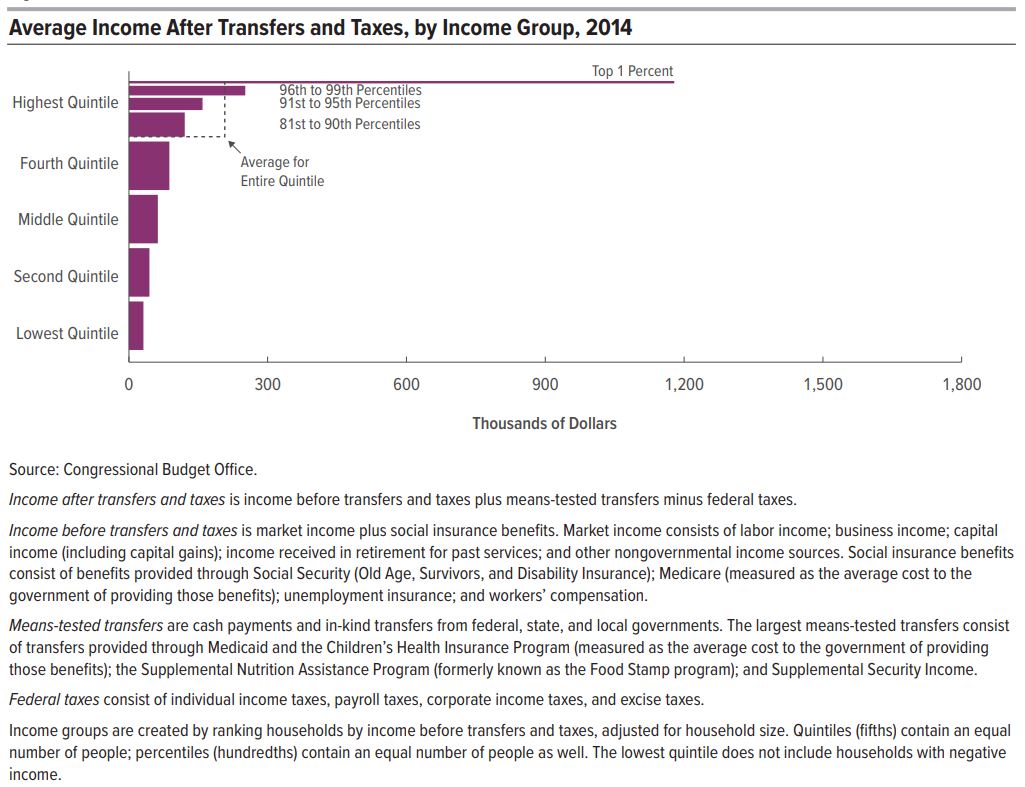
In 2014, household income was unevenly distributed: Households at the top of the income distribution received significantly more income than households at the bottom of the distribution. According to the Congressional Budget Office’s estimates:
- Average income among households in the lowest quintile (or fifth) of the income distribution was about $19,000.
- Average income among households in the highest quintile was about $281,000.
Furthermore, within the highest quintile, income was highly skewed toward the very top of the distribution: Average income among households in the bottom half of the highest quintile (the 81st to 90th percentiles) was about $151,000; average income among the 1.2 million households in the top 1 percent of the distribution was about $1.8 million.
Those amounts include social insurance benefits (such as benefits from Social Security and Medicare) but exclude the effects of governmental policies that directly affect the distribution of household income either through means-tested transfer programs or through the federal tax system.
Means-tested transfers are cash payments and in-kind benefits from federal, state, and local governments that are designed to provide assistance to individuals and families with low income and few assets. They include benefits from government assistance programs such as Medicaid and the Children’s Health Insurance Program (CHIP), the Supplemental Nutrition Assistance Program (SNAP, formerly known as the Food Stamp program), and Supplemental Security Income (SSI). Federal taxes consist of individual income taxes, payroll taxes, corporate income taxes, and excise taxes. Means-tested transfers and federal taxes cause household incomes to be more evenly distributed. In 2014, those transfers and taxes:
- Increased income among households in the lowest quintile by $12,000 (or more than 60 percent), on average, to $31,000.
- Decreased income among households in the highest quintile by $74,000 (or more than 25 percent), on average, to $207,000.
CBO has analyzed the distribution of household income and federal taxes on a recurring basis for more than 30 years. For this report, the agency focused on the distribution of household income in 2014 because that is the most recent year for which relevant data were available when the analysis began. In addition, CBO assessed trends in household income, means-tested transfers, federal taxes, and income inequality over a 36-year period, beginning in 1979 and ending in 2014.
Read the full report here.
From the US Congressional Budget Office (CBO):
In 2014, household income was unevenly distributed: Households at the top of the income distribution received significantly more income than households at the bottom of the distribution. According to the Congressional Budget Office’s estimates:
- Average income among households in the lowest quintile (or fifth) of the income distribution was about $19,000.
- Average income among households in the highest quintile was about $281,000.
Posted by at 3:11 PM
Labels: Macro Demystified
Paul Ehrlich: “Collapse of civilisation is a near certainty within decades”
From an interview article by Damian Carrington:
“Ashattering collapse of civilisation is a “near certainty” in the next few decades due to humanity’s continuing destruction of the natural world that sustains all life on Earth, according to biologist Prof Paul Ehrlich.
In May, it will be 50 years since the eminent biologist published his most famous and controversial book, the Population Bomb. But Ehrlich remains as outspoken as ever.
The world’s optimum population is less than two billion people – 5.6 billion fewer than on the planet today, he argues, and there is an increasing toxification of the entire planet by synthetic chemicals that may be more dangerous to people and wildlife than climate change.
Ehrlich also says an unprecedented redistribution of wealth is needed to end the over-consumption of resources, but “the rich who now run the global system – that hold the annual ‘world destroyer’ meetings in Davos – are unlikely to let it happen”.
[…]
More of Paul and Anne Ehrlich’s reflections on their book are published in The Population Bomb Revisited.”
From an interview article by Damian Carrington:
“Ashattering collapse of civilisation is a “near certainty” in the next few decades due to humanity’s continuing destruction of the natural world that sustains all life on Earth, according to biologist Prof Paul Ehrlich.
In May, it will be 50 years since the eminent biologist published his most famous and controversial book, the Population Bomb. But Ehrlich remains as outspoken as ever.
Posted by at 1:16 PM
Labels: Forecasting Forum
Tuesday, March 20, 2018
A housing recovery without homeowners
From Federal Reserve Bank of St. Louis:
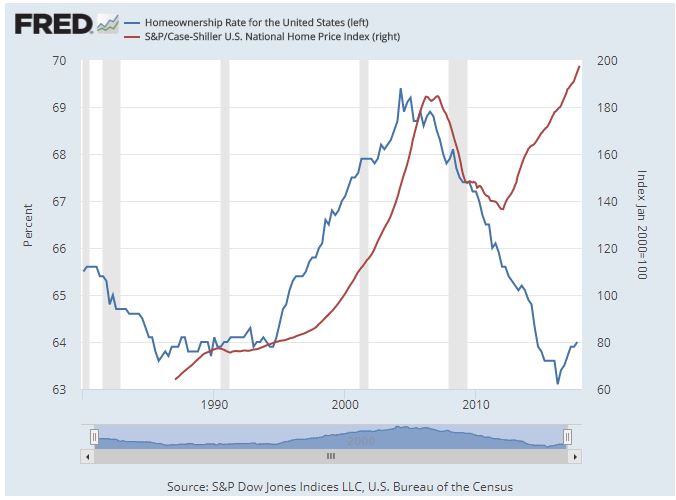
“Historically, the cost of buying a house has been positively correlated with the percent of households that own their home. During 1996 to 2006 in the United States, both the price of houses and the homeownership rate increased. This increasing trend ended abruptly with the global financial crisis, which saw house prices plunge and drove homeownership rates to historically low levels. If homeownership became less attractive in the wake of the financial crisis, we might expect both prices and homeownership to decrease. Similarly, if the current increase in house prices were driven by people buying homes to live in, we might expect the homeownership rate to increase along with prices. However, recent evidence shows that house prices and homeownership are diverging.
The graph shows that, in the wake of the financial crisis, house prices declined by over 25 percent, from an index value of around 180 to around 135. The homeownership rate also dropped from a high of over 69 percent to just over 63 percent, its lowest level since 1980. Unlike in the past, the homeownership rate continued to fall even after house prices began to recover.
Several factors could be driving the decoupling of house prices and the homeownership rate. From the housing supply side, there is a trend toward decreased construction of starter and mid-size housing units. Developers have increased the construction of large single-family homes at the expense of other segments in the market. This limited supply, particularly for starter homes, could result in increased prices for those homes and fewer new homeowners.”
Continue reading here.
From Federal Reserve Bank of St. Louis:
“Historically, the cost of buying a house has been positively correlated with the percent of households that own their home. During 1996 to 2006 in the United States, both the price of houses and the homeownership rate increased. This increasing trend ended abruptly with the global financial crisis, which saw house prices plunge and drove homeownership rates to historically low levels.
Posted by at 5:00 AM
Labels: Global Housing Watch
Monday, March 19, 2018
House Prices in Nambia
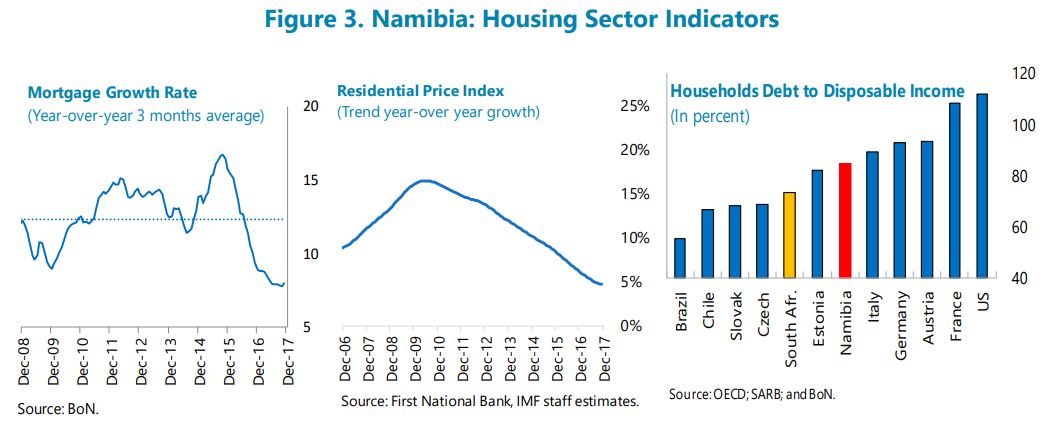
The IMF’s latest report on Namibia says that:
“The rapid rise in housing prices and household debt, banks’ large exposure to mortgages, and banks reliance on wholesale funding are sources of concern. A major decline in real estate prices would adversely affect bank capital and profitability.”
The IMF’s latest report on Namibia says that:
“The rapid rise in housing prices and household debt, banks’ large exposure to mortgages, and banks reliance on wholesale funding are sources of concern. A major decline in real estate prices would adversely affect bank capital and profitability.”
Posted by at 11:21 AM
Labels: Global Housing Watch
Subscribe to: Posts