Thursday, March 22, 2018
How much people make
From the US Congressional Budget Office (CBO):
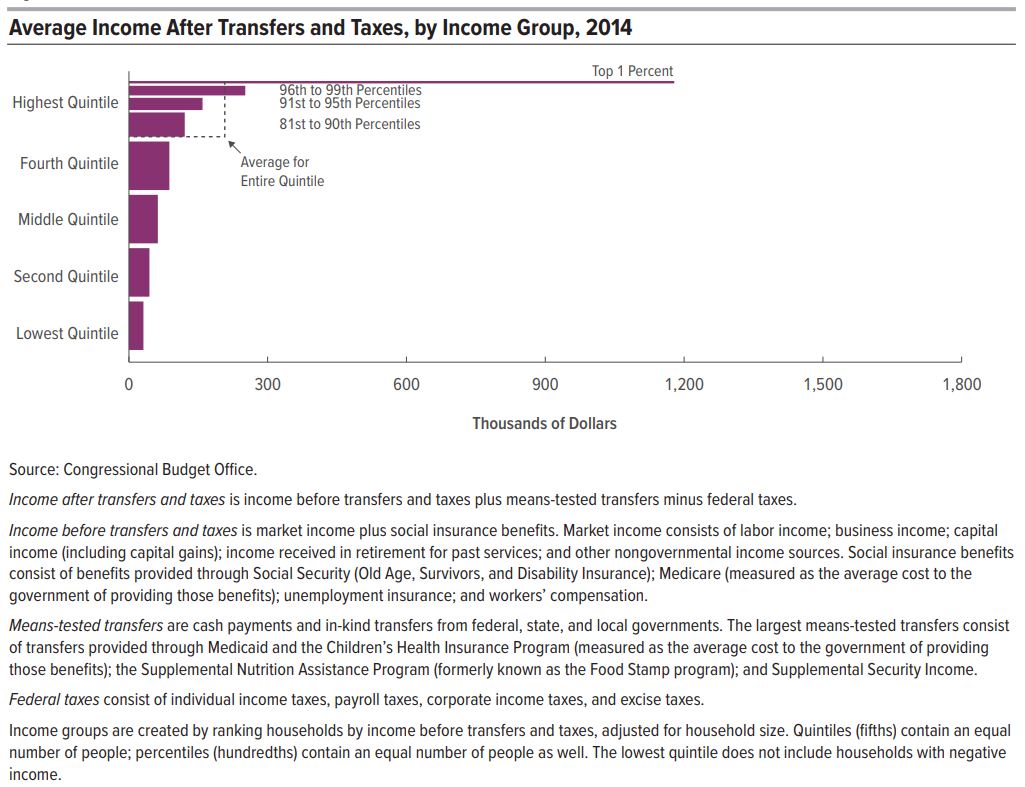
In 2014, household income was unevenly distributed: Households at the top of the income distribution received significantly more income than households at the bottom of the distribution. According to the Congressional Budget Office’s estimates:
- Average income among households in the lowest quintile (or fifth) of the income distribution was about $19,000.
- Average income among households in the highest quintile was about $281,000.
Furthermore, within the highest quintile, income was highly skewed toward the very top of the distribution: Average income among households in the bottom half of the highest quintile (the 81st to 90th percentiles) was about $151,000; average income among the 1.2 million households in the top 1 percent of the distribution was about $1.8 million.
Those amounts include social insurance benefits (such as benefits from Social Security and Medicare) but exclude the effects of governmental policies that directly affect the distribution of household income either through means-tested transfer programs or through the federal tax system.
Means-tested transfers are cash payments and in-kind benefits from federal, state, and local governments that are designed to provide assistance to individuals and families with low income and few assets. They include benefits from government assistance programs such as Medicaid and the Children’s Health Insurance Program (CHIP), the Supplemental Nutrition Assistance Program (SNAP, formerly known as the Food Stamp program), and Supplemental Security Income (SSI). Federal taxes consist of individual income taxes, payroll taxes, corporate income taxes, and excise taxes. Means-tested transfers and federal taxes cause household incomes to be more evenly distributed. In 2014, those transfers and taxes:
- Increased income among households in the lowest quintile by $12,000 (or more than 60 percent), on average, to $31,000.
- Decreased income among households in the highest quintile by $74,000 (or more than 25 percent), on average, to $207,000.
CBO has analyzed the distribution of household income and federal taxes on a recurring basis for more than 30 years. For this report, the agency focused on the distribution of household income in 2014 because that is the most recent year for which relevant data were available when the analysis began. In addition, CBO assessed trends in household income, means-tested transfers, federal taxes, and income inequality over a 36-year period, beginning in 1979 and ending in 2014.
Read the full report here.
Posted by at 3:11 PM
Labels: Macro Demystified
Subscribe to: Posts