


Tuesday, March 12, 2019
Sources of US Greenhouse Gas Emissions
From a new post by Timothy Taylor:
“Each year the Environmental Protection Agency produces an Inventory of U.S. Greenhouse Gas Emissions and Sinks. The draft version of the report for 1990-2017 was published in February 2019.
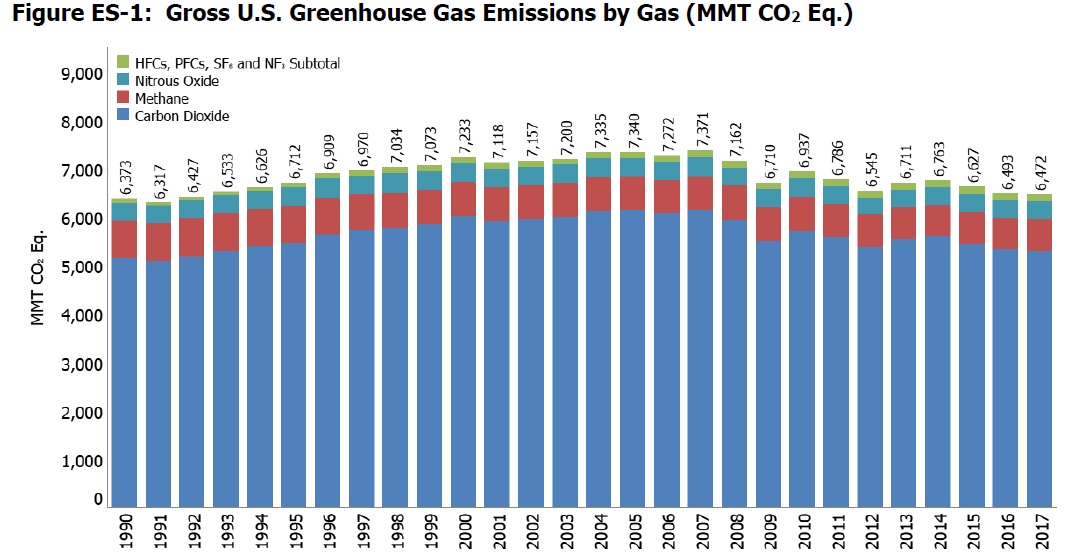
Here’s a figure showing gross emissions of greenhouse gases in the US. Emissions that are not carbon dioxide have been converted to its “equivalent.”
Several themes jump out from the figure. One is that the overwhelming share of emissions are plain old carbon dioxide, rather than methane or other gases. Another is that the total emissions have been dropping in the last few years, and are more-or-less back to 1990 levels, which one can interpret either through the lens of “could be worse” or “should be better,” as you are so inclined.
Given the predominance of carbon dioxide emissions, let’s dig into those a little deeper. Most of the carbon dioxide emissions come from burning fossil fuels. This table shows the breakdown into a few main sectors.
Total US emissions of greenhouse gases in 2017 were 6472 million metric tons of carbon dioxide-equivalent. Thus, transportation and the electric power sector combined account for more than half of all emissions. It seems to me both appropriate to focus on reducing emissions in those sectors, but also to remember that, combined, they are only about half of the problem. Emissions from industrial, residential, and commercial activities are also pretty significant.
Moreover, methane emissions landfill, leakages in natural gas systems, and the digestive tracts of livestock make up the equivalent of 449 million metric tons of carbon dioxide emissions in 2017. Agricultural soil management released nitrogen oxides that are the equivalent of 266 million metric tons of carbon dioxide in 2017, roughly equivalent to fossil fuel-related carbon emissions from the residential or the commercial sector. Hydrofluorocarbons that are being used to to replace ozone-depleting substances account for another 152 million metric tons of CO2-equivalent emissions.

This EPA report is a tabulation of greenhouse gas emissions. It isn’t about questions of how emissions of greenhouse gases might affect climate, or estimating economics costs from changes in climate, or about what methods of addressing greenhouse gas emissions are likely to be more or less cost-effective. For discussions of these points, I recommend a three-paper “Symposium on Climate Change” in the Fall 2018 issue of the Journal of Economic Perspectives. (Full disclosure: My actual paid job, as opposed to my blogging avocation, is Managing Editor of the JEP.) The papers are:
- “An Economist’s Guide to Climate Change Science,” by Solomon Hsiang and Robert E.Kopp
- “Quantifying Economic Damages from Climate Change.” by Maximilian Auffhammer
- “The Cost of Reducing Greenhouse Gas Emissions,” by Kenneth Gillingham and James H.Stock”
From a new post by Timothy Taylor:
“Each year the Environmental Protection Agency produces an Inventory of U.S. Greenhouse Gas Emissions and Sinks. The draft version of the report for 1990-2017 was published in February 2019.
Here’s a figure showing gross emissions of greenhouse gases in the US. Emissions that are not carbon dioxide have been converted to its “equivalent.”
Several themes jump out from the figure.
Posted by at 6:43 PM
Labels: Forecasting Forum
Housing Market in Belgium
From the IMF’s latest report on Belgium:
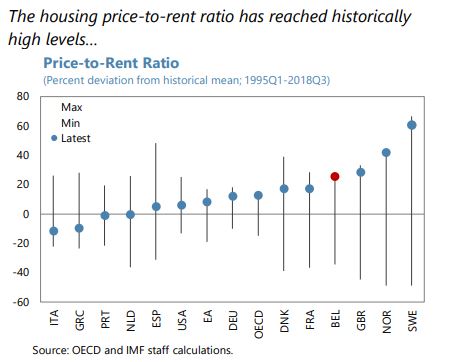
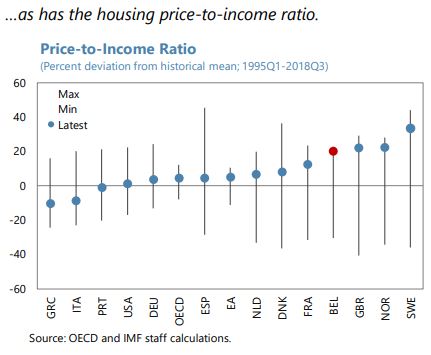
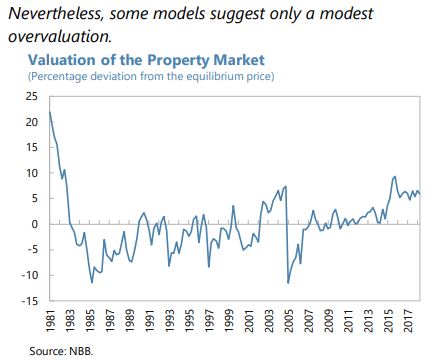
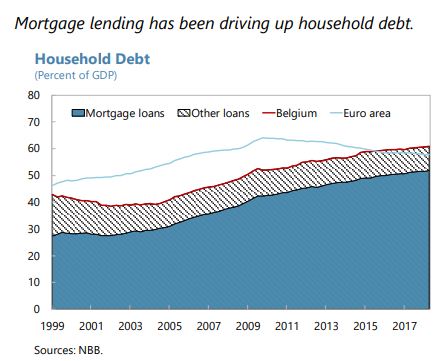
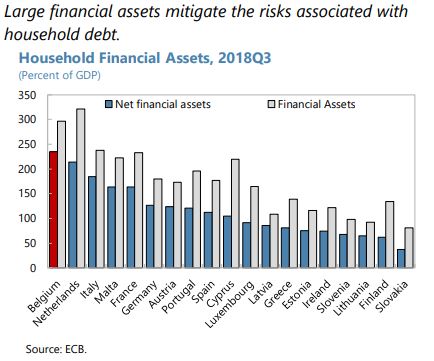
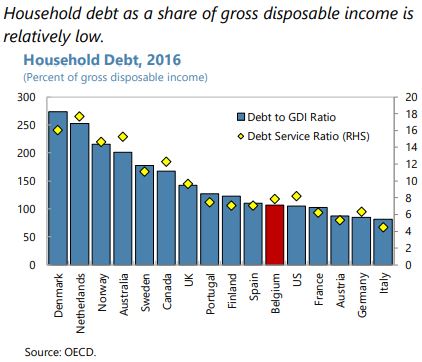
“Private sector indebtedness, primarily associated with household debt, and sustained increases in housing prices pose additional challenges. Strong growth in mortgage lending (9 percent in 2018) has contributed to a sizeable increase in household debt and housing prices. Models, however, point to only a modest house price overvaluation, depending on location. Meanwhile, the share of loans with a loan-to-value (LTV) ratio below 80 percent has declined by about 10 percentage points during 2014–2017. Although default rates are currently low, households have substantial assets in the aggregate, and household debt-to income is in line with peers, a sharp housing (and asset) price correction could result in rising defaults for some groups of the population and affect banks’ solvency, with second round effects on investment, consumption, and growth. 12 Belgian unconsolidated corporate debt has also increased over the last few years to a relatively high level, although, the level is more in line with peers after accounting for intragroup loans. Nonetheless, its dynamics warrant close monitoring, given recent strong bank credit growth to the corporate sector (…).
Staff welcomed the authorities’ recent macroprudential measures to address risks in the housing market and encouraged the authorities to remain proactive. To guard against a correction in housing prices and discourage banks from taking excessive credit risk, the National Bank of Belgium (NBB) introduced in May 2018 an add-on to risk weights on bank mortgage exposures as a new macroprudential measure. In view of the robust overall level of credit growth (5.9 percent in 2018) and credit gap (the NBB estimates this at 2 percent at end Q3-2018), staff recommended that the NBB continue to closely monitor the build-up of cyclical risks in both the household and corporate sectors and stand ready to tighten macroprudential policy further, including through the use of a countercyclical capital buffer. The authorities could also consider revising the framework for macroprudential decision-making to ensure the ability to deploy a broader range of macroprudential policies in a timely manner, as recommended by the 2017 Financial Sector Assessment Program (FSAP) mission.”
From the IMF’s latest report on Belgium:
“Private sector indebtedness, primarily associated with household debt, and sustained increases in housing prices pose additional challenges. Strong growth in mortgage lending (9 percent in 2018) has contributed to a sizeable increase in household debt and housing prices. Models, however, point to only a modest house price overvaluation, depending on location. Meanwhile, the share of loans with a loan-to-value (LTV) ratio below 80 percent has declined by about 10 percentage points during 2014–2017.
Posted by at 9:26 AM
Labels: Global Housing Watch
Housing Market in Malaysia
From the IMF’s latest report on Malaysia:
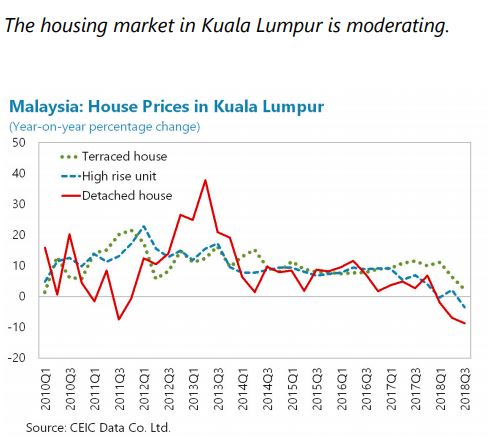
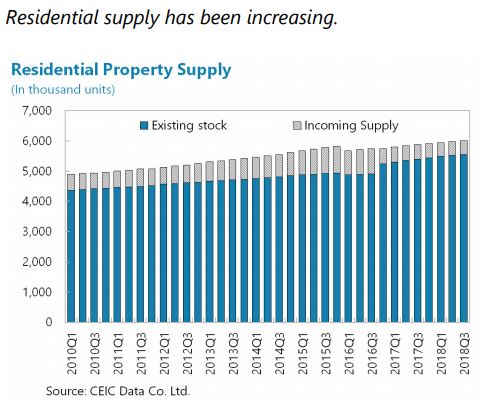
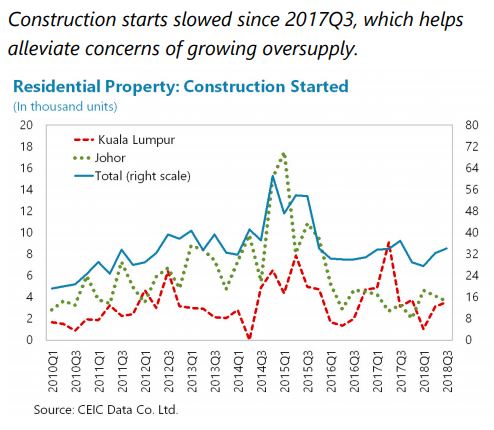
“The authorities continue to closely monitor risks emanating from the housing market, although the risks are deemed manageable (…). House price growth has declined from 6.5 percent in 2017 to 3 percent in 2018H1, and the volume of transactions has also declined. The number of unsold housing units that have been completed or are currently under construction is increasing and is mostly concentrated in high-rise buildings. Banks’ direct exposure to developers remain small and is closely monitored by the BNM. According to BNM stress tests, potential bank losses originating from a possible sharp real estate price adjustment and shocks to income and interest rates are small relative to the banks’ capital buffers. The BNM, MOF, and Ministry of Housing and Local Government have introduced new measures that help reduce the cost of property or of contracting a mortgage loan, with the objective to strengthen the demand for housing and facilitate leasing, and therefore gradually reduce the supply overhang. The impact of these measures should be evaluated on an ongoing basis to ensure effectiveness and correct potential distortions.
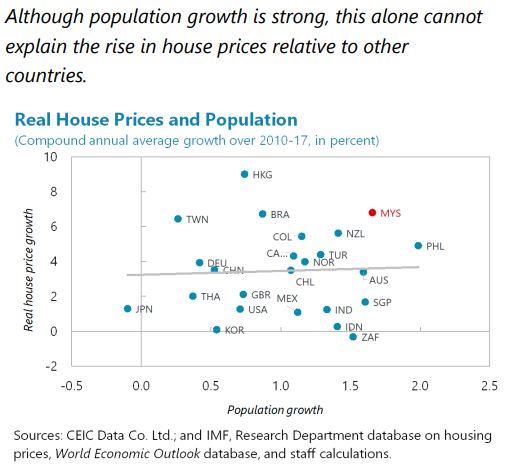
As systemic risks from the housing market dissipate, the residency-based differentiation in the real estate measures introduced in 2014 should be gradually phased out. Given banks’ sizable exposure to mortgage lending and to the construction industry, a real estate market price correction, through a reduction in household and corporate wealth, and these agents’ debt servicing capacity, could have a significant impact on growth and financial stability as NPLs rise. During 2012–13, the Malaysian House Price Index (MHPI) grew by a cumulative 24 percent, well-above its long-run annual average of 6 percent and, in 2014, amid further significant price increases, the number of transactions by non-citizens surged by 30 percent (…). The measures introduced in 2014 helped cool down the market (cutting growth in property purchases by non-citizens by over 50 percent in 2015 and by another 38.9 percent in 2016, and slowing the growth rate of MHPI to 9.4 and 7.4 percent in 2014 and 2015, respectively), avoid significant price adjustments, and reduce the rate of future debt build-up, thus reducing the probability of systemic distress. In the absence of a capital inflow surge for the time-being, but still high household leverage, gradually removing the residency-based differentiation in both measures is recommended as systemic risk dissipates. Carefully calibrated changes to the measures could have the additional benefits of helping to reduce the excess supply of high-end housing where nonresident buyers are concentrated and thereby the probability of a sharp downward price correction. Should the activity in certain segments again threaten financial stability, the authorities may consider macroprudential measures that target the specific segments, without a differentiated treatment of non-residents.”


From the IMF’s latest report on Malaysia:
“The authorities continue to closely monitor risks emanating from the housing market, although the risks are deemed manageable (…). House price growth has declined from 6.5 percent in 2017 to 3 percent in 2018H1, and the volume of transactions has also declined. The number of unsold housing units that have been completed or are currently under construction is increasing and is mostly concentrated in high-rise buildings.
Posted by at 9:20 AM
Labels: Global Housing Watch
Friday, March 8, 2019
How finance affects income inequality
From a new VOX post:
“There is mounting evidence that income inequality and disparities in wealth have been rising in advanced economies in the recent decades. Using data on advanced and emerging economies, this column investigates the link between an economy’s financial structure – that is, the mix of bank-provided versus market-provided funds – and income inequality. Results show that the relationship is not monotonic. More finance reduces income inequality up to a point, but beyond that point inequality rises, especially if finance is expanded via market-based financing.”
[…]
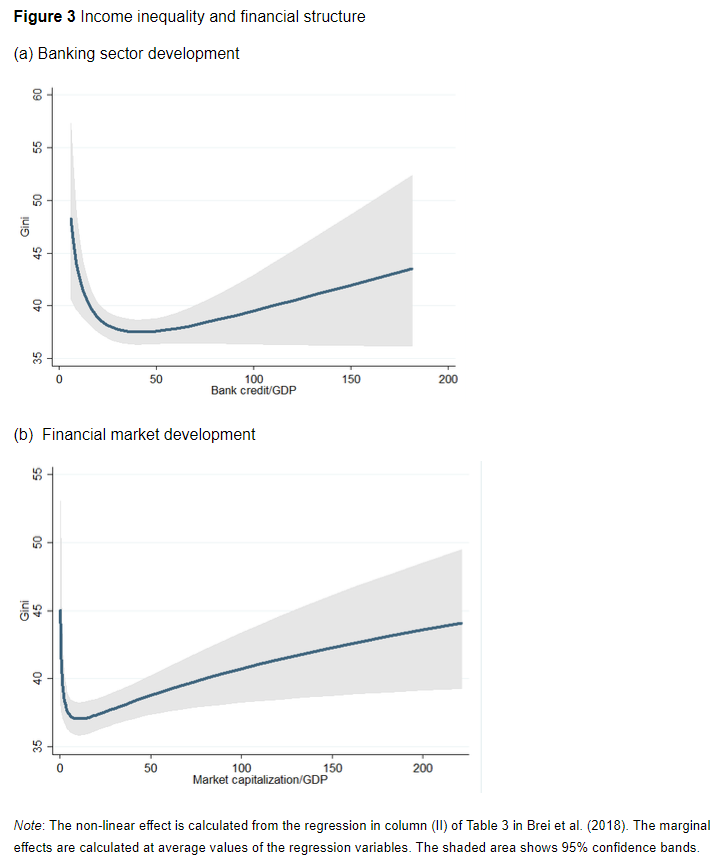
“Making causal inference is a challenge here. The link between finance and income inequality can go either way. More finance can lead to more income inequality, but more inequality may also foster the development of banks and specialised financial services. A common identification strategy employs instruments that are correlated with the financial structure but not correlated with income inequality. Following the literature, in a recent paper (Brei et al. 2018) we instrument the development of banks and financial markets by their initial values, legal origin, societal fractionalisation, and the location of countries (relative to the Equator). Furthermore, we control for other determinants of income inequality, including the degree of education, industrial specialisation, and inflation.
The main results of our regression analysis are represented in Figure 3. Both higher bank activity and higher market activity translate initially into lower income inequality. However, this pattern reverses beyond a certain threshold. The trajectories of income inequality, once the threshold is reached, differ for bank-based versus market-based financial development. Specifically, the subsequent rise in income inequality is much steeper in market-based financial systems. This suggests that the development of financial markets over the last decades could have produced an increase in income inequality. ”
From a new VOX post:
“There is mounting evidence that income inequality and disparities in wealth have been rising in advanced economies in the recent decades. Using data on advanced and emerging economies, this column investigates the link between an economy’s financial structure – that is, the mix of bank-provided versus market-provided funds – and income inequality. Results show that the relationship is not monotonic. More finance reduces income inequality up to a point,
Posted by at 1:49 PM
Labels: Inclusive Growth
Housing View – March 8, 2019
On the US:
- Oregon’s new rent control law is only a band-aid on the state’s housing woes – Brookings
- Trickle-down housing economics – Northwestern University
- Slicing New York’s Housing Pie – New York Times
- Lens, Manville Shape Discussion of How Housing Can Be Coupled to Transit – Citylab
- Protect First Time Buyers and Taxpayers. Let the “Patch” Expire – American Enterprise Institute
- Boston Wants to Flip More Market-Rate Apartments into Affordable Housing – Next City
- Real Time Economics: More Americans Are Buying a Home Again – Wall Street Journal
- Climate change is hurting coastal real estate values. Oh, we’re losing ocean fish, too –Los Angeles Times
- Ask the Economist with Skylar Olsen – DSNews
- The Affordable Housing Crisis Across The U.S.: ‘Where We Call Home,’ Part 1 – wbur
- Oregon, the Rent Control State – Wall Street Journal
- Housing Affordability for Renters Index: Local Perspective and Migration – Urban Institute
- Three differences between black and white homeownership that add to the housing wealth gap – Urban Institute
- Housing Finance At A Glance: A Monthly Chartbook, February 2019 – Urban Institute
- How student debt may foster homeownership – University of Chicago
- Cheaper Housing Options Boost Homeownership in Some U.S. Metros – Bloomberg
- Redfin: These housing markets give low-income families a better shot at the American Dream – HousingWire
On other countries:
- [Australia] The Housing Market and the Economy – Reserve Bank of Australia
- [Australia] Australian House Prices Provide Food for Doves and Hawks – Bloomberg
- [Australia] Here Are the Winners From Australia’s Property-Market Downturn – Bloomberg
- [China] Chinese Banks Will Rise or Fall With the Property Market – Wall Street Journal
- [Luxembourg] No end in sight for upward housing market spiral in Luxembourg – Financial Times
- [Netherlands] As Amsterdam Overheats, Investors See Rent Cap Scaring off Money – Bloomberg
- [Portugal] Portugal’s housing market is strengthening – Global Property Guide
- [Thailand] Thailand’s modest house price rises – Global Property Guide
- [United Kingdom] Some of Britain’s wealthiest areas hit by house price drops of up to 25 percent – Global Property Guide
On the US:
- Oregon’s new rent control law is only a band-aid on the state’s housing woes – Brookings
- Trickle-down housing economics – Northwestern University
- Slicing New York’s Housing Pie – New York Times
- Lens, Manville Shape Discussion of How Housing Can Be Coupled to Transit – Citylab
- Protect First Time Buyers and Taxpayers. Let the “Patch” Expire – American Enterprise Institute
- Boston Wants to Flip More Market-Rate Apartments into Affordable Housing – Next City
- Real Time Economics: More Americans Are Buying a Home Again – Wall Street Journal
- Climate change is hurting coastal real estate values.
Posted by at 5:00 AM
Labels: Global Housing Watch
Subscribe to: Posts