


Sunday, March 20, 2022
Geographical differences in standard of living across US cities
From a VoxEU post by Rebecca Diamond and Enrico Moretti:
“Over the last three decades there has been increased polarisation in income among US communities, but how the standard of living varies across communities is not clear. This column uses transaction data for three million households to examine standards of living – in terms of consumption – in cities across the US by income and education, and how they relate to the local cost of living. For college-educated households, expensive cities offer incomes high enough to offset the higher cost of living and taxes. For less-educated households, expensive cities offer a standard of living that is systematically below that in affordable cities.
Over the last three decades there has been increased polarisation in income among US communities (Austin et al. 2018), while economically vibrant cities such as New York, San Francisco, Boston, and Seattle have experienced fast increases in mean household income. At the same time, less dynamic local labour markets have experienced more limited increases in income and, in some cases, even declines (Moretti 2012). What is less clear is how the actual standard of living of residents varies across communities. The standard of living of residents of a city – which is the amount of consumption households are able to purchase – depends both on the income level that residents can expect there and the local cost of living.
While we know that large, expensive cities tend to have jobs that offer higher nominal earnings and small, affordable cities tend to have jobs that offer lower nominal earnings, we know little about where standards of living are highest. Are residents of dynamic metro areas better or worse off in terms of consumption compared to residents of smaller, economically struggling communities? This lack of information is surprising, because the amount of consumption is arguably a key component of economic wellbeing. There is limited systematic empirical evidence on the differences in consumption across cities and how they relate to local cost of living. The paucity of evidence likely reflects the lack of datasets that can measure consumption and are large enough to allow for a detailed geographical analysis.
In a new paper, we provide the first estimates of standard of living by city for households in a given income or education group and study how they relate to local cost of living (Diamond and Moretti 2021). Our main data source is a representative sample of three million US households’ linked bank and credit card transactions in 2014. We use these to measure the value of consumption expenditures as we observe essentially all debit and credit card transactions, cheque and Automated Clearing House (ACH) payments, and cash withdrawals conducted every day. Our consumption data are comprehensive and include virtually all purchases conducted by individuals in our sample. We quantify how consumption in expensive cities compares with consumption in affordable cities for a given income or educational group.
To measure local prices, we build consumer price indexes that vary by city and income group. Our baseline price index is an index which mimics the index used by the US government to estimate the official national consumer price index (CPI). It is a weighted average of the local prices of items consumed by the average household with income-specific weights reflecting the importance of each item in the bundle for consumers of a given income group. Our data include all items consumed by households, from housing (the most important item) to groceries, restaurants, and other parts of the typical family budget.1
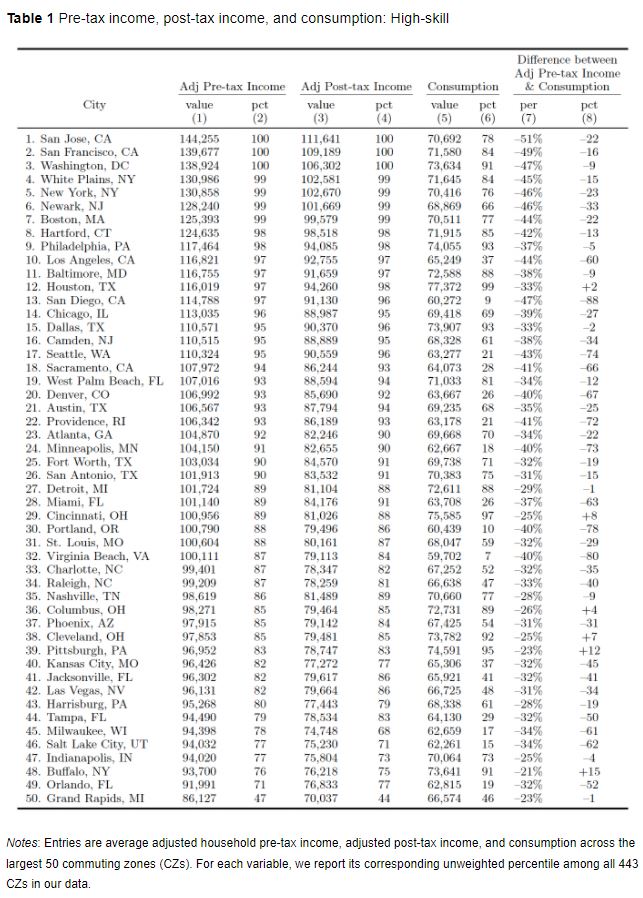
The price indexes point to large differences in cost of living across cities, especially for low-income households. The overall cost of living faced by low-income households (post-tax income less than $50,000) in the most expensive city (San Jose, CA) is 49% higher than in the median city (Cleveland) and 99% higher than in the most affordable city (Natchez, MS). By contrast, we uncover significantly smaller geographical differences for high-income households (post-tax income greater than $$200,000).
Using the prices indexes, we measure the standard of living that low- and high-skill households can expect in each US city and how it varies as a function of local prices. We focus on three skill groups, based on the schooling level of the household head: (i) four-year college or more, (ii) high school or some college, (iii) less than high school.
Table 1 shows our findings for households where the head has a college degree or more for the 50 largest cities in the US. “
From a VoxEU post by Rebecca Diamond and Enrico Moretti:
“Over the last three decades there has been increased polarisation in income among US communities, but how the standard of living varies across communities is not clear. This column uses transaction data for three million households to examine standards of living – in terms of consumption – in cities across the US by income and education, and how they relate to the local cost of living.
Posted by at 7:57 AM
Labels: Global Housing Watch
Saturday, March 19, 2022
Sanctions, energy prices, and the world economy
From Econbrowser:
Posted by at 7:43 AM
Labels: Energy & Climate Change, Macro Demystified
Friday, March 18, 2022
Housing View – March 18, 2022
On cross-country:
- A re-examination of housing bubbles: Evidence from European countries – Economic Systems
On the US:
- Are U.S. Housing Markets Hot, Hot, Hot? – SSRN
- Vacant Homes Everywhere. Census surveys reveal U.S. vacancy rates, but applying the data to a home search or to social issues is complex. – New York Times
- Wells Fargo Rejected Half Its Black Applicants in Mortgage Refinancing Boom. Fewer than half of Black applicants were approved by the biggest bank mortgage lender – Bloomberg
- Housing Market Interventions and Residential Mobility in the San Francisco Bay Area – San Francisco Fed
- How Do Homeowner Experiences Vary by Race and Ethnicity? Neighborhood Differences between Hispanic and White Homebuyers – San Francisco Fed
- The Fed Hits the Housing-Market Wall. There are two ways policy makers could ease stagflation for consumers and industry players. Neither one is without serious challenges. – Bloomberg
- Rent-Control Measures Are Back as Home Rents Reach New Highs. Laws on how much landlords can raise prices are debated in more than a dozen states – Wall Street Journal
- How the War on Sprawl Caused High Housing Prices. Since the 1960s, planners have convinced many state and regional governments to limit the physical spread of urban areas. – Reason
- The housing market’s key metric just took an ugly turn for homebuyers – Fortune
- Introducing “Housing Finance Watch” and “Inflation Watch” – American Enterprise Institute
- The Great Housing Inflation as a Long-Term Policy Failure. High prices of homes and rental apartments have very little to do with today’s general inflation, but reflect decades of perverse policies that hurt both renters and aspiring homeowners. – The American Prospects
- People Deserve to Know Their Houses Are Going to Burn. The old way of insuring against fires isn’t working anymore. – The Atlantic
- Housing Affordability Conditions Wane in January 2022 – National Association of Realtors
- The More Density We Build, the More Valuable “Neighborhood Character” Will Be – Freddie deBoer
- As Rents Soar, States Take Aim at Local Zoning Rules. Local officials, however, say they should decide what gets built where. – PEW
On China
- China Home Prices Drop Faster as Slump Shows No End in Sight. New home prices fell for a sixth straight month in February. Easing measures have failed to arrest a decline in sales – Bloomberg
- Chinese house prices slip lower despite policy loosening. Real estate sector is still struggling but there are signs of recovery in wider market – FT
On other countries:
- [India] Coming UBS Lists Top Real Estate Bets As It Sees Mumbai ‘Construction Boom’ Ahead – Bloomberg
- [New Zealand] FOMO Turns to FOOP in New Zealand’s Cooling Housing Market. Credit squeeze and rising borrowing costs put brake on demand. House prices expected to fall by as much as 10% this year – Bloomberg
On cross-country:
- A re-examination of housing bubbles: Evidence from European countries – Economic Systems
On the US:
- Are U.S. Housing Markets Hot, Hot, Hot? – SSRN
- Vacant Homes Everywhere. Census surveys reveal U.S. vacancy rates, but applying the data to a home search or to social issues is complex. – New York Times
- Wells Fargo Rejected Half Its Black Applicants in Mortgage Refinancing Boom.
Posted by at 5:00 AM
Labels: Global Housing Watch
Wednesday, March 16, 2022
The More Density We Build, the More Valuable “Neighborhood Character” Will Be
From Freddie deBoer:
“My relationship to the YIMBY movement is a little complicated. One issue is a tendency to oversimplification. It’s understandable; the NIMBY position really is so noxious and the stakes are so high that there’s a natural desire to speak in black and white. But here’s a point that I don’t see engaged with much: while the zoning and regulatory hurdles are the major impediment to more building and lower costs, I suspect that even after major reform we won’t see immediate levels of building at the scale YIMBYs want and that we need. I suspect that market forces, inertia, and status quo bias will slow new building (and attendant badly-needed housing cost reductions) more than assumed. Tearing down regulatory barriers is essential, but that by itself won’t turn Pacific Heights into Neo-Tokyo.
I think one reason is that, as more density gets built, neighborhoods that preserve “neighborhood character” – that is, that retain the kind of low density lifestyles that characterize many expensive urban neighborhoods – will get attendantly more expensive. And that will make new building less economically attractive in pure market terms. If the luxury premium that you get from each resident is high enough, you can maintain a profit advantage compared to fitting even a great many more tenants into the same space. Rich people will pay a whole lot to keep other people out.
So if you look at the kind of walkable, low-density Brooklyn brownstone lifestyle a lot of people see as enviable, you’ve got places like Boerum Hill, Fort Greene, Clinton Hill, Park Slope…. These places are expensive for a variety of reasons, but certainly one of them is lower population density and the smaller-scale housing that affords. (You can see this in a neighborhood like Bedford-Stuyvesant, where there’s both very wealthy people and quite poor – and the easiest way to tell which parts are which is to note how dense the housing is.) Right now Park Slope’s large buildings are mostly found on its western edge on 4th Avenue and immediately closest to Prospect Park. In between is a sea of townhouses and other forms of low-density buildings. If we were to enable zoning reform to permit denser building in the streets that are now almost exclusively brownstones, we’d raise the housing stock and create some desperately-needed downward pressures on rents. But we would also find that the kind of bourgie people who would have paid $3 million for a house there would instead start competing for that “small town in a big city” lifestyle in those other neighborhoods, and this competition would make the existing housing stock even more expensive, thus undercutting the financial incentive to tear down low-density housing and put up high rises.
It’s also the case that, since there’s a relationship between housing density and income, the people who would be able to fight against new building most effectively would be those in low-density, even in a much-reformed regulatory environment. Rich people have multiple ways to get what they want, including in a freer housing market. Affluent people can just generate more noise and make life harder on developers even absent the most onerous zoning barriers. Dollars talk. (I had an ex-girlfriend whose family lived in a tony seaside Connecticut town; when someone was going to sell a parcel of land to put up another house on their block, the local residents simply split the cost and bought the lot so that no new building would happen.) And so you can easily imagine a future in which we pass zoning reform and yet Park Slope remains Park Slope, but where a neighborhood like Prospect Lefferts Garden – 75% Black, median income under $40,000, with a lot of single-family housing and a great deal of gentrification anxiety – sees sudden intense building and a resulting change in the demographic composition of the neighborhood. That would enflame precisely the sensitivities that we see in working-class communities of color when new building is proposed. And while I find resistance to such new building misguided, those of us who want to build more have to acknowledge that it’s an ugly thing if rich white people can keep new developments off their block but poor people of color can’t.
(Here’s an NBER paper about the costs of low-density housing such as Brooklyn brownstones, if you’re interested.)”
Continue reading here.
From Freddie deBoer:
“My relationship to the YIMBY movement is a little complicated. One issue is a tendency to oversimplification. It’s understandable; the NIMBY position really is so noxious and the stakes are so high that there’s a natural desire to speak in black and white. But here’s a point that I don’t see engaged with much: while the zoning and regulatory hurdles are the major impediment to more building and lower costs,
Posted by at 7:10 PM
Labels: Global Housing Watch
Tuesday, March 15, 2022
The Shrinking Share of Middle-Income Jobs
From EconoFact:
“The Issue:
Over the past four decades, less-educated workers, particularly non-college men, have experienced an actual fall in their real earnings (that is, after adjusting for inflation). An important reason for this decline in the earnings among low-income workers is the shifting structure of occupations, with a hollowing-out of what had been middle-income jobs. This is especially true in urban and metropolitan areas, places where there had been good job opportunities for those without a college education but, increasingly, the jobs available to those with a high school education in these places are in low-paid occupations with little opportunity for upward mobility.
The Facts:
- Rising wage inequality is a well-documented characteristic of the U.S. labor market over the past 40 years; but such divergence in earnings was not a feature of the preceding decades. The post-World War II period can be divided into three eras with respect to the distribution of wages. The period from immediately after World War II until 1972 was a time when wages were rising evenly for people with all levels of education. In contrast, the period that began with the first oil shock in 1973 through the end of the 1970s saw inflation-adjusted earnings stagnate across the board. Subsequently, beginning in 1980 and continuing to the present there has been rising wage inequality, with wages rising robustly for the most educated and falling, in real terms, for the least educated. This is especially striking because the supply of highly-educated workers has increased while that of less-educated workers has declined; the share of hours worked by those without a college degree fell from 75 percent in 1963 to less than 40 percent in 2017 while over the same period the share of hours worked by those with a bachelor’s or post-college degree rose from less than 15 percent to more than 35 percent.
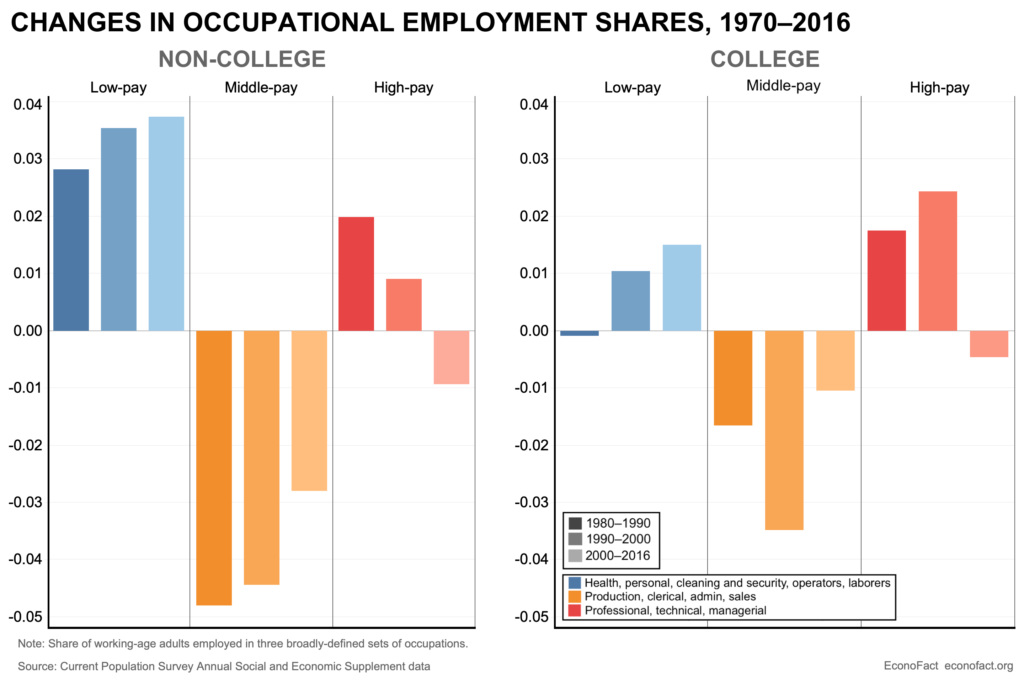
- An important source of these shifts in wages and hours is the hollowing out of middle-income jobs. While there are a range of reasons for the decline in wages and hours worked for those with less than a college education (including eroding union power, rising trade in manufacturing goods from low-labor-cost countries, and falling real values of minimum wages), an important reason that has not had as much attention is the decline in jobs that had provided middle-class wages for those with less than a college education. The shrinking share of these middle-income jobs appears as a “barbell effect” with the decline of middle-paid jobs contrasted by the rise in the employment share for both lower- and higher-paid jobs (see chart). Employment can be sorted into three broadly defined sets of occupations: those with typically low pay and education requirements that require little specialized skills or training (health aids and personal services, cleaning and security, and operators and laborers); middle-paid occupations that do not necessarily demand a four-year college degree but do require specialized skills (production workers, office/administrative workers, and sales workers); and high-paid occupations that typically require a four-year degree (technicians, professionals, and managers). In 1980, non-college workers were evenly split between low- and medium-paid occupations (at 42 percent and 43 percent, respectively) and the remaining one-seventh of workers without college degrees were in traditionally high-paid occupations. By 2016, the share of non-college educated workers in mid-pay occupations had fallen to 29 percent, with about 12 of the overall 14 percentage point decline representing a shift to the low-paid category and less than a 1.5 percentage point increase in the high-pay category. Over this same period, there was a more modest barbell effect for college-educated workers, with those in the mid-pay occupations declining from 27 to 20 percent, those in high-pay occupations rising from 57 to 61 percent, and those in low-paying occupations rising from 16 to 19 percent.
- There are technological, global and institutional reasons why this “barbell effect” was concentrated among workers in urban and metropolitan areas. In the 1950s and 1960s, workers in urban areas who did not have college degrees disproportionately held middle-education, middle-income, blue-collar production jobs and white-collar office, administrative and clerical jobs as compared to workers in suburban and rural areas. These jobs involved close collaboration with more highly-educated professional, managerial and technical workers who oversaw factories and offices. This collaboration benefited workers holding these middle-income jobs since their value to their companies was enhanced by high-education coworkers. But starting in the 1970s, the demand for mid-education urban workers declined due to rising automation in factories, greater use of computers and information technology in offices, and greater pressure from international trade. Workers without a college degree moved from middle-income occupations to those that traditionally require less education and offer lower wages – and because middle-income jobs for those without a college degree were more prevalent in urban and metropolitan areas, this had a proportionally bigger effect in those places. “
Continue reading here.
From EconoFact:
“The Issue:
Over the past four decades, less-educated workers, particularly non-college men, have experienced an actual fall in their real earnings (that is, after adjusting for inflation). An important reason for this decline in the earnings among low-income workers is the shifting structure of occupations, with a hollowing-out of what had been middle-income jobs. This is especially true in urban and metropolitan areas, places where there had been good job opportunities for those without a college education but,
Posted by at 7:22 PM
Labels: Macro Demystified
Subscribe to: Posts