Sunday, March 20, 2022
Geographical differences in standard of living across US cities
From a VoxEU post by Rebecca Diamond and Enrico Moretti:
“Over the last three decades there has been increased polarisation in income among US communities, but how the standard of living varies across communities is not clear. This column uses transaction data for three million households to examine standards of living – in terms of consumption – in cities across the US by income and education, and how they relate to the local cost of living. For college-educated households, expensive cities offer incomes high enough to offset the higher cost of living and taxes. For less-educated households, expensive cities offer a standard of living that is systematically below that in affordable cities.
Over the last three decades there has been increased polarisation in income among US communities (Austin et al. 2018), while economically vibrant cities such as New York, San Francisco, Boston, and Seattle have experienced fast increases in mean household income. At the same time, less dynamic local labour markets have experienced more limited increases in income and, in some cases, even declines (Moretti 2012). What is less clear is how the actual standard of living of residents varies across communities. The standard of living of residents of a city – which is the amount of consumption households are able to purchase – depends both on the income level that residents can expect there and the local cost of living.
While we know that large, expensive cities tend to have jobs that offer higher nominal earnings and small, affordable cities tend to have jobs that offer lower nominal earnings, we know little about where standards of living are highest. Are residents of dynamic metro areas better or worse off in terms of consumption compared to residents of smaller, economically struggling communities? This lack of information is surprising, because the amount of consumption is arguably a key component of economic wellbeing. There is limited systematic empirical evidence on the differences in consumption across cities and how they relate to local cost of living. The paucity of evidence likely reflects the lack of datasets that can measure consumption and are large enough to allow for a detailed geographical analysis.
In a new paper, we provide the first estimates of standard of living by city for households in a given income or education group and study how they relate to local cost of living (Diamond and Moretti 2021). Our main data source is a representative sample of three million US households’ linked bank and credit card transactions in 2014. We use these to measure the value of consumption expenditures as we observe essentially all debit and credit card transactions, cheque and Automated Clearing House (ACH) payments, and cash withdrawals conducted every day. Our consumption data are comprehensive and include virtually all purchases conducted by individuals in our sample. We quantify how consumption in expensive cities compares with consumption in affordable cities for a given income or educational group.
To measure local prices, we build consumer price indexes that vary by city and income group. Our baseline price index is an index which mimics the index used by the US government to estimate the official national consumer price index (CPI). It is a weighted average of the local prices of items consumed by the average household with income-specific weights reflecting the importance of each item in the bundle for consumers of a given income group. Our data include all items consumed by households, from housing (the most important item) to groceries, restaurants, and other parts of the typical family budget.1
The price indexes point to large differences in cost of living across cities, especially for low-income households. The overall cost of living faced by low-income households (post-tax income less than $50,000) in the most expensive city (San Jose, CA) is 49% higher than in the median city (Cleveland) and 99% higher than in the most affordable city (Natchez, MS). By contrast, we uncover significantly smaller geographical differences for high-income households (post-tax income greater than $$200,000).
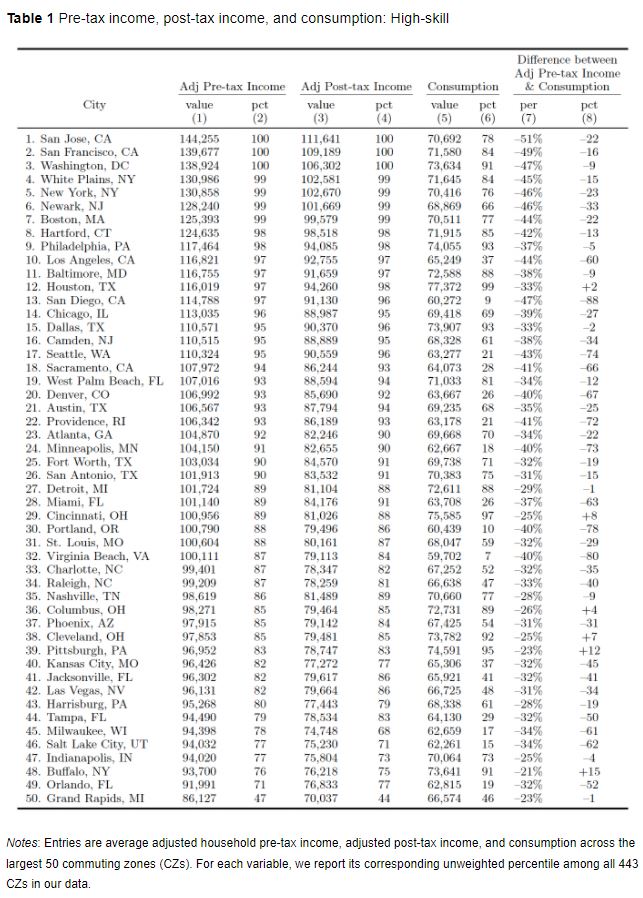
Using the prices indexes, we measure the standard of living that low- and high-skill households can expect in each US city and how it varies as a function of local prices. We focus on three skill groups, based on the schooling level of the household head: (i) four-year college or more, (ii) high school or some college, (iii) less than high school.
Table 1 shows our findings for households where the head has a college degree or more for the 50 largest cities in the US. “
Posted by at 7:57 AM
Labels: Global Housing Watch
Subscribe to: Posts