


Saturday, January 22, 2022
Why Ireland’s housing bubble burst
From Works in progress:
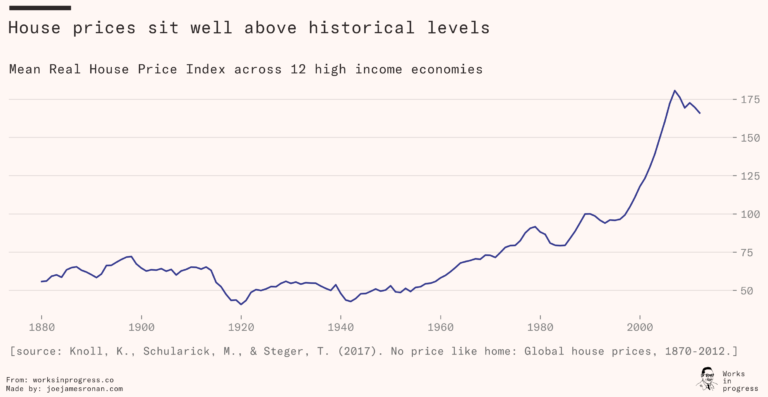
“Ireland had arguably the world’s largest housing bubble and crash in the 2000s, with prices quadrupling in the decade to 2007, even while supply soared, before crashing by more than half between 2007 and 2012. Unsurprisingly, this extreme experience has been the subject of much research. Housing has become a critical economic, social and political issue in many cities across the high-income world. At its worst, it even threatens the very concept of living standards in high-income countries, gobbling up a third or even half of the disposable incomes of individuals and households in some locations. But it wasn’t always like this. Adjusting for inflation, the price of housing in high-income countries underwent ups and downs in the century to the 1960s but the trend was largely stable. Though the timing varies by country, it has only been in the last half-century or so that the price of housing has shot up like a hockey stick.
As the world’s largest economy, the United States has been the highest-profile market to make this transition, along with a number of other countries that have followed the same patterns. Ireland is at the extreme end. Like a Rorschach test, people look at Ireland and see whatever suits them most in making arguments about housing and economic policy.
But many of these arguments rely on simplistic myths about what happened. Contrary to many of these claims, Ireland was not a story of overbuilding caused by laissez-faire policy, or an experience that defied standard economics. Ireland built very few ghost towns – housing excesses, where they occurred, were a product of government tax policy, rather than irrational markets. And supply and demand perform very well in explaining the trends. Failing to understand these basics will mean we are susceptible to making the same mistakes all over again.
I have spent much of the last fifteen years studying the Irish housing system, following it from the heights of the Celtic Tiger bubble to the following crash and the subsequent decade of rising prices. There are, to my mind, three myths that have emerged about the Irish housing market that muddy the waters in our understanding of housing markets not just there but everywhere.”
From Works in progress:
“Ireland had arguably the world’s largest housing bubble and crash in the 2000s, with prices quadrupling in the decade to 2007, even while supply soared, before crashing by more than half between 2007 and 2012. Unsurprisingly, this extreme experience has been the subject of much research. Housing has become a critical economic, social and political issue in many cities across the high-income world. At its worst,
Posted by at 1:16 PM
Labels: Global Housing Watch
Chart of the day…. or century?
From Mark J. Perry (AEI):
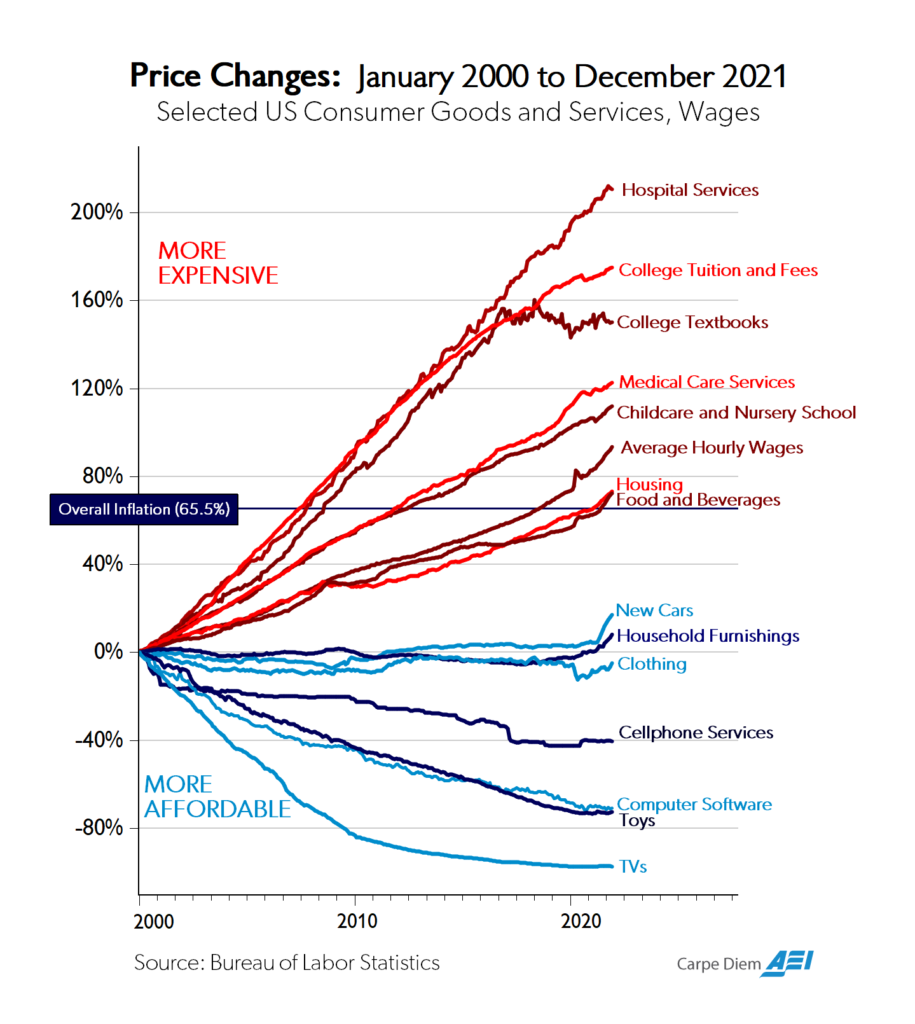
“As I wrote in the summer of 2018 on CD, I’ve probably created and posted more than 3,000 graphics on CD, Twitter, and Facebook including charts, graphs, tables, figures, maps, and Venn diagrams over the last 16 years. Of all of those graphics, I don’t think any has gotten more attention, links, re-Tweets, re-posts, and mentions than previous versions of the chart above, which was once referred to as “the Chart of the Century.” Here are some examples of the attention that past versions of the chart above have gotten:
*Marketwatch has featured the chart twice here and here and made this comment “When this chart’s creator, econ professor Mark Perry and the man behind the Carpe Diem blog, first posted it on Twitter, it was hailed as “stunning” and “one of the most important charts about the economy this century.“
*Barry Ritholz has featured various versions of the chart three times on his Big Picture Blog here, here, and here.
*Bloomberg published an article in July 2018 titled “Chart of Century Gives Powell Gloomy Glimpse of Trade-War World,” with this opening:
A multi-colored graphic that’s made the rounds at the Federal Reserve hints at what Chairman Jerome Powell could face if President Donald Trump succeeds in throwing globalization into reverse: Higher prices for many goods and potentially faster inflation.
Plugged as possibly the chart of the century by economist and originator Mark Perry, it shows that prices of goods subject to foreign competition — think toys and television sets — have tumbled over the past two decades as trade barriers have come down around the world. Prices of so-called non-tradeables — hospital stays and college tuition, to name two — have surged.”
From Mark J. Perry (AEI):
“As I wrote in the summer of 2018 on CD, I’ve probably created and posted more than 3,000 graphics on CD, Twitter, and Facebook including charts, graphs, tables, figures, maps, and Venn diagrams over the last 16 years. Of all of those graphics, I don’t think any has gotten more attention, links, re-Tweets, re-posts, and mentions than previous versions of the chart above, which was once referred to as “the Chart of the Century.” Here are some examples of the attention that past versions of the chart above have gotten:
*Marketwatch has featured the chart twice here and here and made this comment “When this chart’s creator,
Posted by at 1:09 PM
Labels: Macro Demystified
Why skyscrapers are so short
From Works In progress:
“There’s a pattern that we frequently see in the development of a new technology. Initially, the practical functionality is limited by the technology itself – what’s built and used is close to the limit of what the technology is physically capable of doing. As the technology develops and its capabilities improve, there’s a divergence between what a technology can physically do and what it can economically do, and you begin to see commercialized versions that have lower performance but are more affordable. Then, as people begin to build within this envelope of economic possibility, capability tends to get further constrained by legal restrictions, especially if the new technology has any (real or perceived) negative externalities.
Cars and speed limits provide an illustrative example. The first production car, the Benz Velo, was also the fastest car, with a top speed of about 12 miles per hour. The technology quickly improved, and by the 1940s the fastest production cars were capable of traveling over 100 miles per hour, with specially built test cars achieving nearly 375 miles per hour.
“Economic” speed lagged behind this – the maximum speed of the most popular car of 1952 (the Buick Roadmaster) was 91 miles per hour. And because traveling at high speeds has negative externalities (excess crashes, pedestrian safety, etc.), states began to enact speed limits as car speed increased that further capped how fast cars would be allowed to travel. The first speed limit in the US appeared in Connecticut in 1901, limiting speed in cities to 12 miles per hour (the most popular car sold that year, the Oldsmobile Curved Dash, topped out at around 20 miles per hour).
Construction technology also shows this dynamic, with engineering, economic, and legal maximums diverging. The economic height of buildings is lower than what’s physically capable of being built, and once that economic height rises high enough we will start to see legal restrictions spring up that further limit building height.
A brief history of building height
Civilization has been putting up buildings for long enough that we find buildings hitting their economic and legal limits even in ancient history. Roman builders were capable of constructing buildings over 150 feet (48 meters) in height, or about 13 modern storeys – the Colosseum is 159 feet (48.4 meters) tall, and the Pantheon is 141 feet (43 meters) tall. Economic height lagged behind this – textual evidence suggests that Roman residential buildings (insulae) maxed out at around 7 or 8 storeys, with 5 or 6 storeys being more common. Legal limits were sometimes even lower: to reduce the risk of collapse (which was apparently not uncommon) various emperors issued edicts limiting the maximum building height. Augustus limited the height of buildings to 70 Roman feet (slightly greater than an imperial foot), which was then further restricted by Trajan to 60 feet.”
Continue reading here.
From Works In progress:
“There’s a pattern that we frequently see in the development of a new technology. Initially, the practical functionality is limited by the technology itself – what’s built and used is close to the limit of what the technology is physically capable of doing. As the technology develops and its capabilities improve, there’s a divergence between what a technology can physically do and what it can economically do,
Posted by at 1:06 PM
Labels: Global Housing Watch
Modelling Okun’s Law – Does non-Gaussianity Matter?
From a paper by Tamás Kiss, Hoang Nguyen and Pär Österholm:
“In this paper, we have analysed the relevance of taking non-Gaussianity into account when empirically modelling Okun’s law in Australia, the euro area, the United Kingdom and the United States. Our results based on Bayesian VAR models with stochastic volatility suggest that heavier-than-Gaussian tails find support in some cases. Taking skewness into account is, however, less beneficial in this context considering our baseline sample. Our results confirm that it is important to account for heavy tails in the distribution of macroeconomic variables, an argument put forward by Fagiolo et al. (2008) and Ascari et al. (2015) among others.
It should be noted though that our results to some extent depend on whether data from the corona pandemic are included or not. We believe that including them might be problematic since they should probably be treated as outliers (see the discussion in Carriero et al., 2021). If they nevertheless are treated as regular observations, our analysis indicates that the evidence of non-Gaussianity strengthens. In addition, it can be noted that accounting for non-Gaussianity not only improves the model fit in several cases but it also captures the large swings in the variables without causing large swings in the stochastic volatility.
Apart from the modelling perspective, our analysis has also provided updated international empirical evidence concerning Okun’s law. We find that the dynamic relationship between the variables in all four economies is such that a shock to GDP growth has robustly negative effects on the change in the unemployment rate. This finding is robust to whether we include the period associated with the corona pandemic or not. It confirms Ball et al. (2017) and Ball et al. (2019) who argue that Okun’s law continues to be a robust relationship in empirical macroeconomics. This should be highly relevant information to the central banks of the economies studied here, suggesting that Okun’s law – which has been an important empirical relationship when modelling the economy continues to be useful regardless of modelling choices and time periods.”
From a paper by Tamás Kiss, Hoang Nguyen and Pär Österholm:
“In this paper, we have analysed the relevance of taking non-Gaussianity into account when empirically modelling Okun’s law in Australia, the euro area, the United Kingdom and the United States. Our results based on Bayesian VAR models with stochastic volatility suggest that heavier-than-Gaussian tails find support in some cases. Taking skewness into account is, however, less beneficial in this context considering our baseline sample.
Posted by at 9:50 AM
Labels: Macro Demystified
Does Financial “Bonanza” Cause Premature Deindustrialization?
A recent working paper by A. Botta et al (2022) of the Levy Economics Institute analyzes factors that may have hindered productive development for over four decades prior to the COVID-19 pandemic.
Abstract: We investigate the role of (non-FDI) net capital inflows as a potential source of premature deindustrialization. We consider a sample of 36 developed and developing countries from 1980 to 2017, with major emphasis on the case of emerging and developing economies (EDE) in the context of increasing financial integration. We show that periods of abundant capital inflows may have caused the significant contraction of manufacturing share to employment and GDP, as well as the decrease of the economic complexity index. We also show that phenomena of “perverse” structural change are significantly more relevant in EDE countries than advanced ones. Based on such evidence, we conclude with some policy suggestions highlighting capital controls and external macroprudential measures taming international capital mobility as useful tools for promoting long-run productive development on top of strengthening (short-term) financial and macroeconomic stability.
A recent working paper by A. Botta et al (2022) of the Levy Economics Institute analyzes factors that may have hindered productive development for over four decades prior to the COVID-19 pandemic.
Abstract: We investigate the role of (non-FDI) net capital inflows as a potential source of premature deindustrialization. We consider a sample of 36 developed and developing countries from 1980 to 2017,
Posted by at 7:36 AM
Labels: Macro Demystified
Subscribe to: Posts