


Tuesday, February 27, 2018
Warren Buffett Summarizes Investment Lessons from Winning His 10-year Bet that a Passive S&P 500 Index Fund Would Out-Perform Actively Managed Hedge Funds
From a new blog by Mark J. Perry:
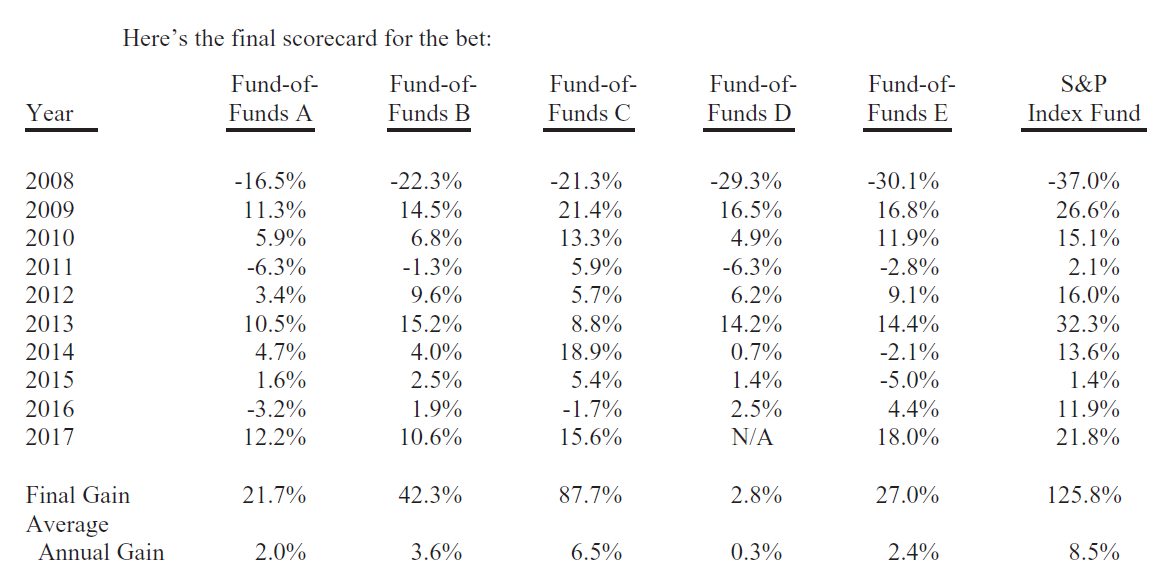
“In Warren Buffett’s 2017 annual letter to shareholders, released on Saturday, he discussed the ten-year bet he made in 2007 that an unmanaged, low-cost S&P-500 index fund would out-perform an actively managed group of high-cost hedge funds over a ten-year period from 2008 to 2017, when performance is measured on a basis net of fees, costs, and all expenses. See posts here, here and here for past coverage of Buffett’s famous bet.”

From a new blog by Mark J. Perry:
“In Warren Buffett’s 2017 annual letter to shareholders, released on Saturday, he discussed the ten-year bet he made in 2007 that an unmanaged, low-cost S&P-500 index fund would out-perform an actively managed group of high-cost hedge funds over a ten-year period from 2008 to 2017, when performance is measured on a basis net of fees, costs, and all expenses.
Posted by at 6:17 AM
Labels: Forecasting Forum, Macro Demystified
Sunday, February 25, 2018
The UK’s Housing Problem…
Global Housing Watch Newsletter: February 2018
This post is written by David Miles. He is a Professor of Financial Economics at Imperial College Business School. Please bear in mind that these are the views of Professor Miles, and should not be attributed to the IMF.
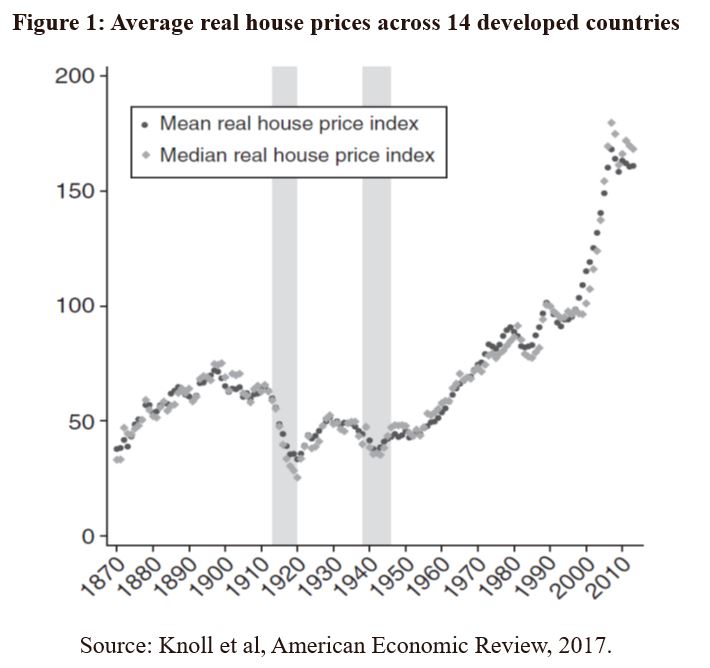
Average house prices in the UK have risen dramatically faster than average incomes over the past 30 years. Relative to average disposable incomes houses are almost three times as expensive now as they were in the mid-1980s. But this is not something specific to the UK and neither is it uniform across the UK. Recent evidence on house prices across a large sample of developed economies back to the mid nineteenth century reveals two things[1]. First, that on average house prices moved roughly in line with the price of other things between about 1870 and 1970 in most countries; and second that over the past fifty years house prices have – again on average across developed countries – roughly tripled relative to the price of other things (see figure 1 below).
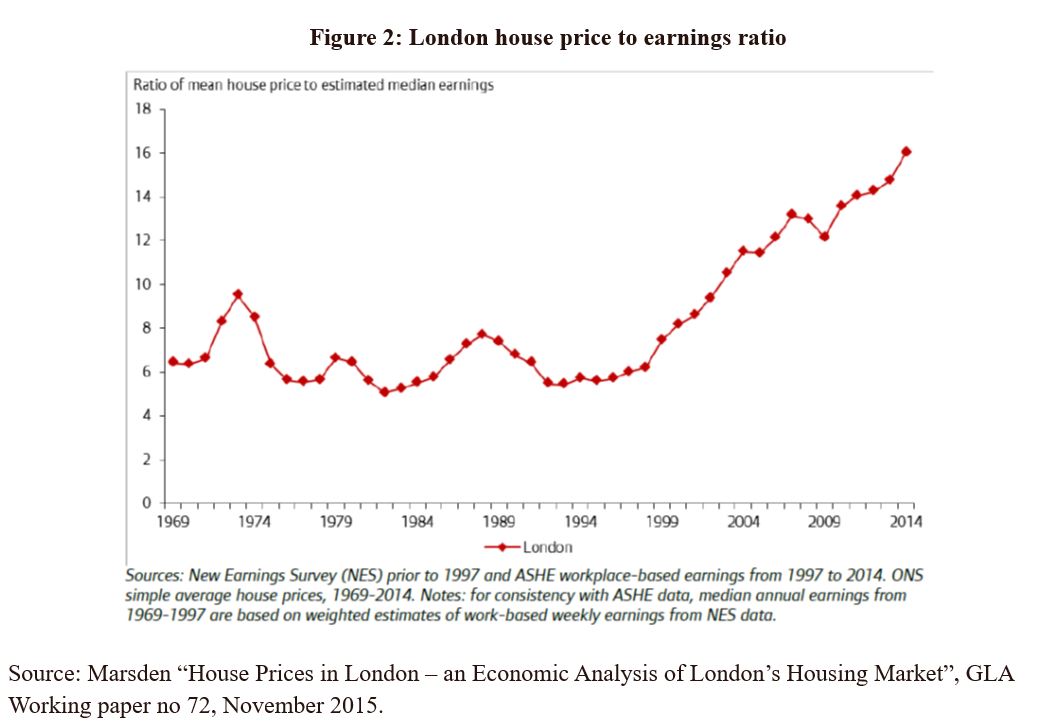
So there is nothing unique about the fact that in the UK house prices have in recent decades risen very much faster than the price of most other things and that houses have become dramatically much more expensive than cars, food, clothes, electrical goods, energy and travel. And the degree to which that has happened is very different across the UK. In London – the centre of the most densely populated South-East corner of the country – average house prices have risen far faster than in most other parts of the country (figure 2).
Why has this happened? We can start by dismissing one theory – which is that the rising cost of constructing houses has driven up prices. In fact, the cost of building houses can account for only a tiny part of the huge rise in the relative price of houses. Increases in the price of land on which houses can be built, in contrast, have risen enormously and account for most of the increase in the value of houses. But “account for” does not mean “explain” – one has not explained why house values have risen so fast by noting the enormous increase in the price of land on which houses can be built in the places where people want to live. You just push the question back to why land values have risen so much.
Part of that answer is connected to panning restrictions – and some people are satisfied to leave that as the answer. But those restrictions are not just arbitrary and they do reflect real effects upon quality of life or more building in already densely populated parts of a country. Such restrictions exist in most countries and are typically most binding in parts of countries where population densities and house prices are high. This suggests that more fundamental forces are at work than just the much-quoted inefficiencies of arbitrary UK planning rules.
In recent work with James Sefton I have tried to assess the extent to which these more fundamental forces might account for the relentless upward movements in house prices[2]. Our focus is on the long run. We consider the housing sector within a model of the overall economy that aims to explain overall economic growth, saving and asset prices. Any long run analysis has to model the changing supply of housing taking into account the fixity of land mass and the way in which shifts in the cost of land relative to structures changes the way in which houses are constructed. Land is obviously not homogenous and the impact of the most important way in which it differs (that is by location) varies over time as technological change means that distance may have a varying effect on value. One obvious way in which this happens is if transportation costs change.
We find that there is great sensitivity over time in the pattern of development, the types of houses built and the values of structures to even small changes in two key parameters: the degree of substitutability of land and structure in creating houses; the degree to which households substitute between housing and non-housing goods. But the great sensitivity of the equilibrium (or fundamental) housing cost trajectory to small changes in these two key elasticities means it is hard to know whether house prices relative to incomes rising to levels not seen before is the start of a bubble or just the natural path we should expect in an economy with a rising population, growing incomes and with a population density higher than in the past. Using a simple metric like the house price to income ratio relative to its history is unlikely to be a very reliable guide to whether prices are out of line with fundamentals. Having a system of rules (e.g. on acceptable loan to value ratios for mortgages) that would tend to bind ever tighter as house price to income ratios rise will be problematic if the fundamental equilibrium is that this ratio should be rising for many decades.
We find that it is not difficult to find sets of assumptions about elasticities which are plausible in the light of existing evidence and which imply that house prices can rise faster than incomes for periods spanning generations. This has nothing to do with planning restrictions.
Ultimately housing over the long term could become increasingly expensive and perhaps increasingly rented. That would be more likely if:
A. population and productivity both grow steadily
B. people are increasingly unwilling to live high in the sky or even underground, which will limit the scope to economise on land use.
C. people do not substitute much away from spending money on houses and divert it to other consumption as house prices rise.
D. there is no improvement in transport infrastructure and travel times. That would limit how far from the most densely populated and popular urban centres people can live.
These four conditions probably all hold in the UK. That sounds like bad news. But major investment in transport infrastructure that reduce commuting times could mean future house price rises can still be limited.
[1]Katharina Knoll, Moritz Schularick, and Thomas Steger. No price like home: global house prices, 1870.2012. The American Economic Review, 107(2):331.353, 2017.
[2] “Houses Across Time and Space”, David Miles and James Sefton, CEPR Discussion 12103.
Global Housing Watch Newsletter: February 2018
This post is written by David Miles. He is a Professor of Financial Economics at Imperial College Business School. Please bear in mind that these are the views of Professor Miles, and should not be attributed to the IMF.
Average house prices in the UK have risen dramatically faster than average incomes over the past 30 years.
Posted by at 7:30 PM
Labels: Global Housing Watch
G-20 Thematic Workshop on Residential and Commercial Property Price Indices
Global Housing Watch Newsletter: February 2018
This post is written by Niall O’Hanlon. Mr. O’Hanlon joined the IMF in 2015 as a senior economist in the Real Sector Division of the IMF’s Statistics Department. Prior to joining the IMF, Mr. O’Hanlon was Head of Prices Division at the Central Statistics Office Ireland (CSO). During his 14-year career at the CSO he introduced a number of new statistical products including the Residential Property Price Index (RPPI) and the Services Producer Price Index (SPPI).
A recent G-20 Thematic Workshop on Residential and Commercial Property Price Indices provided the participating countries with an opportunity to exchange views on compilation practices and use of the residential and commercial property prices for policy purposes, as well as on country-specific challenges. It highlighted progress and identified key challenges in the compilation of such indices. To advance work, participants agreed on the need to be pragmatic, data-oriented, and take account of available private source data.
The workshop, which is part of the 2018 work program of the G-20 Data Gaps Initiative (DGI), aimed to support the participant economies’ efforts to advance the implementation of two challenging recommendations on the compilation of real estate price statistics. As Argentina holds the G-20 Presidency in 2018, the event was hosted by the Instituto Nacional de Estadística y Censos de la República Argentina in Buenos Aires on January 29-30, 2018. The workshop was jointly organized by the Bank for International Settlements (BIS), Eurostat, IMF, and the Organisation for Economic Co-operation and Development. About 80 officials attended the event.
DGI and Real Estate Price Statistics
In 2009, the G-20 Finance Ministers and Central Bank Governors endorsed twenty recommendations to address data gaps revealed by the global financial crisis. The initiative, aimed at supporting enhanced policy analysis, is led by the Financial Stability Board and the IMF. The first phase of the DGI was successfully concluded in September 2015 when the second phase (DGI-2) was launched. The DGI-2 aims to implement, through the five-year horizon of the initiative, the regular collection and dissemination of common datasets that are relevant for policy use in the G-20 economies. Two of the DGI-2 recommendations specifically cover real estate price statistics: Recommendation II.17 on Residential Property Price Indices (RPPIs) and Recommendation II.18 on Commercial Property Price Indices (CPPIs).
Compilation of Residential Property Price Indices
For residential property prices, Recommendation II.17 aims that, by 2021, the G-20 economies compile and publish RPPIS broadly representative of the residential property market and consistent with the Handbook on Residential Property Price Indices preferably as official statistics. Additionally, it has been agreed that associated indicators on housing would be included in the project to provide as complete a picture as possible of the residential real estate market.
The recent workshop in Argentina confirmed that good progress was made by the participants in compiling and reporting the RPPI data with 19 of the economies now reporting indices to the Bank for International Settlements. However, compilation practices across participating economies vary in terms of coverage, source of data; quality-mix adjustment methods, the length of timeseries, and the availability of aggregated data.
Key challenges for compilers include availability of transaction prices (as opposed to appraised prices) and the time lag between the actual transaction and its recording. Several participating countries discussed research on using Big Data, primarily collected from real estate websites, in place of administrative data found to be inadequate. Compilation of RPPIs is an ongoing process and even after indexes are published, compilers should continuously strive to improve them through better source data and improved compilation methods. Presentations from a number of countries highlighted recent and ongoing developments in respect of such improvements.
Indicators on Housing
Following the June 2017 Global Conference on the DGI, a template on house prices and related housing indictors was put forward to the G-20 economies for written consultation, and subsequently endorsed at the January 2018 workshop. The template is organized around five topics aimed at better understanding the housing market situation in individual countries:
- RPPIs;
- Other price indicators relating to housing;
- The residential property market;
- Housing stock – size, value and vacancy rates; and
- Construction.
The template provides for all indicators definitions, breakdown, geographical coverage, frequency, measures and starting periods and distinguishes between higher and lower priority indicators.
Participants emphasized the strong demand for RPPI data for policy use such as monetary policy, monitoring economic performance (including at regional level) and forecasts, and for financial stability surveillance.
Compilation of Commercial Property Price Indices
For the emerging development of CPPIs, Recommendation II.18 of the DGI aims to enhance the guidance on the compilation of CPPIs and to encourage dissemination of data prices via the BIS website.
Eurostat has recently published a statistical report on “Commercial property price indicators: sources, methods and issues.” The publication underscores the challenges in compiling official CPPIs and related measures of the commercial property market. These include the limited availability of information on transactions, heterogeneity of commercial properties complicating the quality mix-adjustment methods, and scarce expertise.
Recognizing these difficulties, the participants in DGI thematic workshop broadly agreed that the way forward should be pragmatic, data-oriented, and should also support the compilation of other commercial property market indicators—consistent with the requirements for a broader range of real estate market indicators to inform financial sector risk and macroprudential policy. Participants also broadly agreed that a short to medium-term solution is to rely on already available price and associated indicators from private sources.
Relative to the availability of RPPIs, a reduced number of G-20 economies compile CPPI data, and in most cases, improvements are needed.
Upcoming Events on Real Estate Price Statistics
The Central Bank of the Republic of Turkey will host a workshop on compilation of CPPIs in May 2018. In February 2019, Eurostat will organize an International Conference on Real Estate Statistics.
Global Housing Watch Newsletter: February 2018
This post is written by Niall O’Hanlon. Mr. O’Hanlon joined the IMF in 2015 as a senior economist in the Real Sector Division of the IMF’s Statistics Department. Prior to joining the IMF, Mr. O’Hanlon was Head of Prices Division at the Central Statistics Office Ireland (CSO). During his 14-year career at the CSO he introduced a number of new statistical products including the Residential Property Price Index (RPPI) and the Services Producer Price Index (SPPI).
Posted by at 7:17 PM
Labels: Global Housing Watch
Friday, February 23, 2018
Housing View – February 23, 2018
On the US:
- Jon Gray: Blackstone’s real estate chief turns heir apparent – Financial Times
- The Role of Technology in Mortgage Lending – Federal Reserve Bank of New York
On other countries:
- [Australia] Housing Market Imbalances in Australia: Development, Prospects, and Policies – IMF
- [Australia] Household Indebtedness and Mortgage Stress – Reserve Bank of Australia
- [Canada] Canada province readies housing plan amid affordability crisis – Reuters
- [Canada] British Columbia takes aim at housing speculation – Reuters
- [Canada] Vancouver’s Hot Housing Market Gets Tougher for Wealthy Chinese – Bloomberg
- [China] Housing Price, Consumption, and Financial Market: Evidence from Urban Household Data in China – ASCE
- [Malaysia] Unsold residential units in Malaysia at highest level for a decade – Global Property Guide
- [Spain] Mortgage Finance and Culture – IZA Institute of Labor Economics
- [Switzerland] Geneva’s ‘safe-haven’ houses look vulnerable – Financial Times
- Out of Sync Subnational Housing Markets and Macroprudential Policies – CESifo Group Munich
- [United Kingdom] UK’s Housing Market – IMF
- [United Kingdom] House prices and rents in the UK – mainly macro
- [United Kingdom] London, Residential Market Outlook, Spring 2018 – Cluttons
- [United Kingdom] A Fix to the U.K. Housing Crunch: Have More Money – Citylab

Photo by Aliis Sinisalu
On the US:
- Jon Gray: Blackstone’s real estate chief turns heir apparent – Financial Times
- The Role of Technology in Mortgage Lending – Federal Reserve Bank of New York
On other countries:
- [Australia] Housing Market Imbalances in Australia: Development, Prospects, and Policies – IMF
- [Australia] Household Indebtedness and Mortgage Stress – Reserve Bank of Australia
- [Canada] Canada province readies housing plan amid affordability crisis – Reuters
- [Canada] British Columbia takes aim at housing speculation – Reuters
- [Canada] Vancouver’s Hot Housing Market Gets Tougher for Wealthy Chinese – Bloomberg
- [China] Housing Price,
Posted by at 6:53 AM
Labels: Global Housing Watch
Wednesday, February 21, 2018
Mortgage Finance and Culture
From a new paper by Núria Rodríguez-Planas (IZA Institute of Labor Economics):
“Using a nationally representative sample of 12,344 immigrants from 41 different countries of ancestry living in Spain in 2007, we find that the higher the housing-loan penetration in the country of ancestry, the higher the likelihood of having a mortgage in Spain. Similarly, the higher the mortgage depth in the country of ancestry, the higher the present value of the monthly mortgage payments. Our results suggest that social norms regarding mortgage finance in the country of ancestry matter in determining immigrants’ mortgage finance in the host country. More specifically, the effect of social norms on the decision to have a mortgage (the extensive margin) and the amount of the mortgage payments (the intensive margin) is about one third and tenth the size of the effect of having a college degree on mortgage debt, respectively. Evidence of strong persistence of culture among those with longer tenure in the host country, those who immigrated as children or young adults, and second-generation immigrants suggests that vertical transmission of beliefs (from parents to children) is a plausible channel of transmission. Perhaps most importantly, we find that cultural attitudes regarding property rights are most relevant when explaining individuals’ decision to get a mortgage, but those regarding credit information matter most when explaining the amount of the mortgage debt.”
From a new paper by Núria Rodríguez-Planas (IZA Institute of Labor Economics):
“Using a nationally representative sample of 12,344 immigrants from 41 different countries of ancestry living in Spain in 2007, we find that the higher the housing-loan penetration in the country of ancestry, the higher the likelihood of having a mortgage in Spain. Similarly, the higher the mortgage depth in the country of ancestry, the higher the present value of the monthly mortgage payments.
Posted by at 1:40 PM
Labels: Global Housing Watch
Subscribe to: Posts