



Sunday, April 24, 2022
Health, income, and the Preston curve
From VoxEU post by Leandro Prados de la Escosura:
“GDP per capita is a commonly used, but imperfect, proxy for human wellbeing. This column analyses the relationship between life expectancy at birth and per capita income over the past 150 years. It shows that life expectancy and per capita income growth behaved differently in terms of trends and distribution over the period. The relationship was particularly weak during the period 1914 to 1950. Separately, medical improvements and the diffusion of medical knowledge have been crucial drivers of life expectancy improvements across the world.
Human wellbeing is increasingly viewed as a multidimensional phenomenon, of which income is only one facet (Stiglitz et al. 2009, OECD 2011, Proto and Rustichini 2014). However, economists continue to rely on GDP to gauge wellbeing (Oulton 2012). A way to assess GDP as a comprehensive measure of wellbeing is by looking beyond per capita income. In a recent paper, I focus on life expectancy at birth – a synthetic measure of health – and its relationship with per capita income over the past 150 years (Prados de la Escosura 2022).
An important caveat is that, when assessing life expectancy over time and across countries, we need to bear in mind that original values of life expectancy are bounded and that life quality improves with the quantity of years lived (Prados de la Escosura 2021). A solution is provided by Kakwani’s (1993) non-linear transformation in which an increase in life expectancy at birth at a higher level implies a greater achievement than would have been the case had it occurred at a lower level.
Trends in life expectancy and per capita income
Life expectancy (expressed as a Kakwani index) exhibits slightly faster long-run growth than per capita GDP. A closer look, however, reveals an apparent development puzzle: economic growth and life expectancy gains do not match each other (Table 1). During the globalisation backlash between 1914 and 1950, real per capita GDP growth slowed down as world commodity and factor markets disintegrated, while life expectancy experienced major gains across the board. But, from 1950 onwards, life expectancy achieved, on average, smaller gains to GDP per head. Thus, world average life expectancy exhibited a major advance across the board before 1950, earlier than usually presumed and at odds with the view that that global health only improved after WWII, when new drugs from the West reached the rest of the world (Acemoglu and Johnson 2007, Klasing and Milionis 2020).”
Continue reading here.
From VoxEU post by Leandro Prados de la Escosura:
“GDP per capita is a commonly used, but imperfect, proxy for human wellbeing. This column analyses the relationship between life expectancy at birth and per capita income over the past 150 years. It shows that life expectancy and per capita income growth behaved differently in terms of trends and distribution over the period. The relationship was particularly weak during the period 1914 to 1950.
Posted by at 7:58 AM
Labels: Macro Demystified
18 spectacularly wrong predictions were made around the time of the first Earth Day in 1970, expect more this year
From Mark Perry (AEI):
“Tomorrow is Earth Day 2022 and marks the 52nd anniversary of Earth Day, so it’s time for my annual CD post on the spectacularly wrong predictions that were made around the time of the first Earth Day in 1970…..
In the May 2000 issue of Reason Magazine, award-winning science correspondent Ronald Bailey wrote an excellent article titled “Earth Day, Then and Now: The planet’s future has never looked better. Here’s why” to provide some historical perspective on the 30th anniversary of Earth Day. In that article, Bailey noted that around the time of the first Earth Day in 1970, and in the years following, there was a “torrent of apocalyptic predictions” and many of those predictions were featured in his Reason article. Well, it’s now the 51st anniversary of Earth Day, and a good time to ask the question again that Bailey asked 21 years ago: How accurate were the predictions made around the time of the first Earth Day in 1970? The answer: “The prophets of doom were not simply wrong, but spectacularly wrong,” according to Bailey. Here are 18 examples of the spectacularly wrong predictions made around 1970 when the “green holy day” (aka Earth Day) started:
1. Harvard biologist George Wald estimated that “civilization will end within 15 or 30 years [by 1985 or 2000] unless immediate action is taken against problems facing mankind.”
2. “We are in an environmental crisis that threatens the survival of this nation, and of the world as a suitable place of human habitation,” wrote Washington University biologist Barry Commoner in the Earth Day issue of the scholarly journal Environment.
3. The day after the first Earth Day, the New York Times editorial page warned, “Man must stop pollution and conserve his resources, not merely to enhance existence but to save the race from intolerable deterioration and possible extinction.”
4. “Population will inevitably and completely outstrip whatever small increases in food supplies we make,” Paul Ehrlich confidently declared in the April 1970 issue of Mademoiselle. “The death rate will increase until at least 100-200 million people per year will be starving to death during the next ten years [by 1980].”
5. “Most of the people who are going to die in the greatest cataclysm in the history of man have already been born,” wrote Paul Ehrlich in a 1969 essay titled “Eco-Catastrophe! “By…[1975] some experts feel that food shortages will have escalated the present level of world hunger and starvation into famines of unbelievable proportions. Other experts, more optimistic, think the ultimate food-population collision will not occur until the decade of the 1980s.”
Continue reading here.
From Mark Perry (AEI):
“Tomorrow is Earth Day 2022 and marks the 52nd anniversary of Earth Day, so it’s time for my annual CD post on the spectacularly wrong predictions that were made around the time of the first Earth Day in 1970…..
In the May 2000 issue of Reason Magazine, award-winning science correspondent Ronald Bailey wrote an excellent article titled “Earth Day,
Posted by at 7:56 AM
Labels: Energy & Climate Change, Forecasting Forum
Friday, April 22, 2022
Housing View – April 22, 2022
On cross-country:
- These Are the World’s Most Affordable and Least Affordable Cities to Buy a Home – Bloomberg
- We Need Public Housing, Not Affordable Housing. Homeownership is out of reach for millions in Canada and the US. One well-meaning response to this crisis has been to call for more affordable housing. But we should be demanding more social housing instead. – Jacobin
On the US:
- Inflation, Interest and the Housing Paradox – New York Times
- Are We Approaching Bubble Territory in the U.S. Real Estate Market? – Realtor
- US homebuilders say materials are getting easier to find – Quartz
- The case for granny flats. Adding density would boost housing supply and lower emissions – The Economist
- Demographics, COVID-19 Leave Construction with Tight Labor Supply – St. Louis Fed
- Changing Minds on Restrictive Zoning: How to Unclog America’s Home Supply – Manhattan Institute
- Concentration in Homebuilding Driven by a Few Large Builders – Harvard Joint Center for Housing Studies
- High Building Materials Prices Erode Preference for New Construction – NAHB
- What’s Ahead for Cities & Real Estate – Wall Street Journal
- Are Some Homebuyers Strategically Transferring Climate Risks to Lenders? – Richmond Fed
- Property taxes lagged in 2021 — even as real estate prices soared – Axios
- The Sky-High Pandemic Housing Market Finds Gravity Does Exist. Mortgage costs have jumped as the Federal Reserve has raised rates. With higher rates come fewer offers – New York Times
- Decade-High Mortgage Rates Pose Threat to Spring Housing Market. Demand remains strong, but borrowing rates are climbing at fastest pace in years – Wall Street Journal
- Housing Market Fever Starts to Break in Boise – Bloomberg
- Homeowner Groups Seek to Stop Investors From Buying Houses to Rent. Suburban neighborhoods are rewriting rules as rental investors’ purchases surge – Wall Street Journal
- Home Costs and Rents Are Soaring. When Buying Makes Sense – Barron’s
- Higher Rates Start to Cool Canada’s Hot Housing Market. Transactions fall 5.4%, their biggest drop in nine months. Benchmark prices up 27% year-over-year on shortage of homes – Bloomberg
On other countries:
- [Australia] Australia’s COVID-19 pandemic housing policy responses – AHURI
- [Canada] Canada Wants to Double Home Construction But Needs to Find Workers – Canada
- [Germany] Constraints on bank lending unlikely to halt upward residential price spiral – REFIRE
- [Greece] Housing markets, the great crisis, and metropolitan gradients: Insights from Greece, 2000–2014 – IDEAS
- [United Kingdom] House prices to fall? Definitely, but not quite yet. While values are high, real interest rates are negative, making homes surprisingly affordable – FT
On cross-country:
- These Are the World’s Most Affordable and Least Affordable Cities to Buy a Home – Bloomberg
- We Need Public Housing, Not Affordable Housing. Homeownership is out of reach for millions in Canada and the US. One well-meaning response to this crisis has been to call for more affordable housing. But we should be demanding more social housing instead. – Jacobin
On the US:
- Inflation,
Posted by at 5:00 AM
Labels: Global Housing Watch
Wednesday, April 20, 2022
Figuring out efficient unemployment
From a VoxEU post by Pascal Michaillat and Emmanuel Saez:
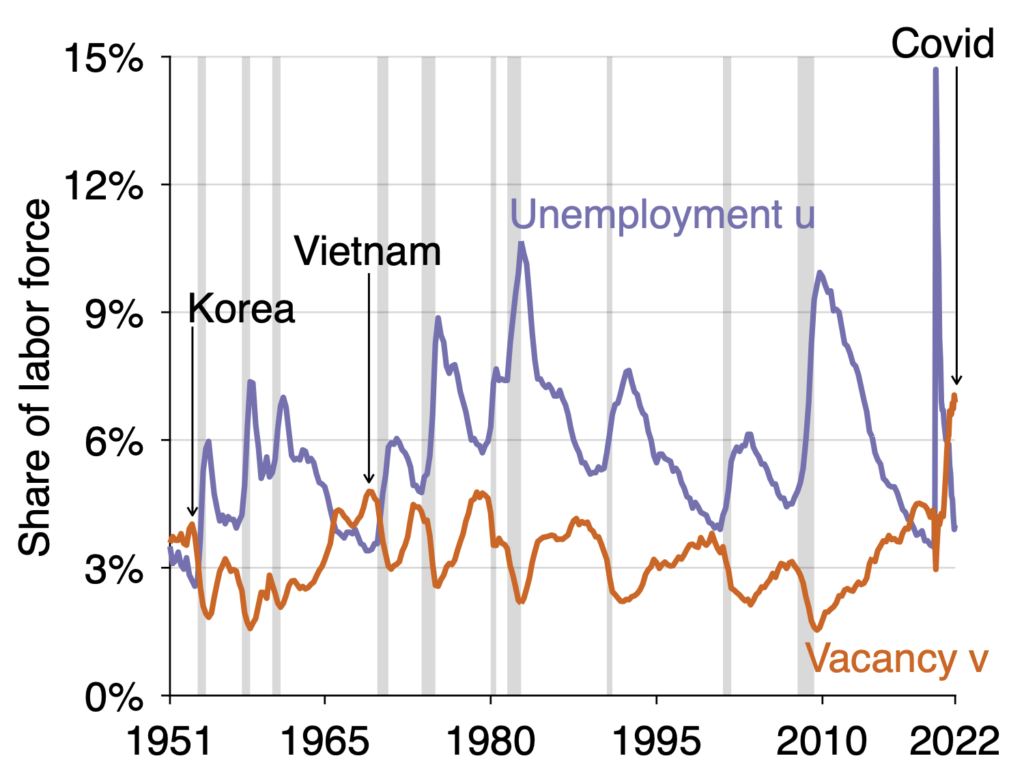
“Empirically, the unemployment rate is inversely related to the vacancy rate. Furthermore, servicing a job opening costs about as much as one job in terms of resources. This column shows that the labour market minimises waste when the unemployment rate equals the vacancy rate. It is too slack when the unemployment rate is higher and too tight when it is lower. Consequently, the efficient unemployment rate is simply given by the geometric average of the current unemployment and vacancy rates. At the beginning of 2022, the US labour market is excessively tight, and tighter than at any point since 1951.
Knowing whether an economy is too slack or at risk of overheating is crucial for macroeconomic policy. Economists generally look at price inflation, GDP level relative to potential, and the unemployment rate to assess, this but each measure has issues as can be seen when looking at the current US economy coming out of the Covid-19 crisis.1 An increase in inflation, as experienced in 2021, can be a marker of an overheating economy, but inflation can also increase due to temporary disruptions such as supply chain issues. Assessing whether GDP is below or above potential is challenging as a crisis like Covid-19 also affects the productive potential of the economy. The unemployment rate is 3.6% as of March 2022, not yet lower than just before Covid-19 when the economy did not show signs of overheating.
In this column, we propose a very simple rule to assess whether the economy, or more precisely the labour market, is too tight or too slack: are there more job openings than there are unemployed workers? This simple rule has intuitive appeal. If somehow job seekers were to be matched to job openings, would there be excess job openings, suggesting an economy with a shortage of willing workers (i.e. an overly tight labour market), or would there be excess job seekers left, suggesting an economy with too few jobs (i.e. an overly slack labour market)? It turns out that this simple intuitive rule can also be justified using the modern matching model that economists use.2 This reconciles economic theory with the widely scrutinised job-seeker-per-job-opening statistic.3
The Beveridge curve
William Beveridge first noted in 1944 that the number of job openings and the number of job seekers in the UK move in opposite directions: When the economy is depressed, there are lots of job seekers and few job openings. Conversely, when the economy is booming, there are few job seekers and many job openings. This relationship has therefore been dubbed the ‘Beveridge curve’ and holds remarkably well in the US as well.4 Figure 1 depicts the time series of the unemployment rate u (all job seekers divided by the labour force which includes all workers and job seekers) and the vacancy rate v (all job openings divided by the same labour force) since 1951. The figure shows clearly that u and v move in opposite directions.”
Figure 1 The US unemployment and vacancy rates since 1951
Continue reading here.
From a VoxEU post by Pascal Michaillat and Emmanuel Saez:
“Empirically, the unemployment rate is inversely related to the vacancy rate. Furthermore, servicing a job opening costs about as much as one job in terms of resources. This column shows that the labour market minimises waste when the unemployment rate equals the vacancy rate. It is too slack when the unemployment rate is higher and too tight when it is lower.
Posted by at 11:28 AM
Labels: Macro Demystified
Friday, April 15, 2022
Housing View – April 15, 2022
On the US:
- The American property market is once again looking bubbly. Soaring mortgage rates have yet to cool exuberant demand – The Economist
- The housing market is running hot. Can the Fed cool it before it crashes? S&P Global considers 88% of U.S housing regions overvalued – Market Watch
- Early signs of cooling housing market seen in some U.S. cities, Redfin says – Reuters
- The new risk to the housing market – Politico
- What Higher Mortgage Rates Mean for the Housing Market. Wharton’s Benjamin Keys explains why higher mortgage interest rates are discouraging home buyers, but not for long. – Wharton
- Homebuyers Get Desperate in Overheated U.S. Spring Sales Season. Soaring mortgage rates and prices are fueling a rush to seal a deal in market where competition for houses is intense. – Bloomberg
- Fed’s Quantitative Tightening Throws a Wrench Into Mortgage-Bond Market. Investors have been cautious with mortgage bonds, and the Fed’s latest policy signals are unlikely to resolve all their concerns – Wall Street Journal
- Senators Romney, Lee Introduce Bill to Increase Utah Housing Supply – Mitt Romney
- The Landscape of Middle-Income Housing Affordability in California – Terner Center
- Raise Residential Taxes? Bring in Casinos? Cities Look at Ways to Bolster Budgets. Leaders in urban areas struggling with pandemic hits to business and travel revenues are brainstorming longer-term strategies – Wall Street Journal
- How Homeownership Changes You. It’s not just a financial commitment. It can alter people’s relationships to a community, a place, and even time. – The Atlantic
- House-flipping algorithms are coming to your neighborhood. Despite millions of dollars in losses, iBuying’s failure doesn’t signal the end of tech-led disruption, just a fumbled beginning. – Bloomberg
- Pandemic-fueled suburban growth doesn’t mean we should abandon climate resiliency – Brookings
- Understanding the U.S. Housing Crisis in an Era of Inflation. Economist Jenny Schuetz offers a practical guide to one of the biggest challenges facing renters and homebuyers: the skyrocketing cost of housing. – Bloomberg
On China
- China Banks Allow Mortgage Payment Holiday in Covid-Hit Shanghai. Shanghai reports record new infections as lockdown extended. Megabanks’ profit growth at risk amid Covid, property weakness – Bloomberg
On other countries:
- [Australia] Melbourne and Sydney suburbs lead housing value declines – CoreLogic
- [Canada] Canada targets housing, banks in modest-spending budget – Reuters
- [Canada] Canada plans to double homebuilding in decade, but where are the workers? – Reuters
- [Canada] ‘The Top Is Off’: Home Prices Show Signs of Cracking in Canada’s Hot Market. Industry experts are predicting Canada’s home prices could finally start to decline after a 50% surge over the past two years. – Bloomberg
- [Canada] Bank of Canada rate hike could cool Canada’s hot housing markets, economists say – The Globe and Mail
- [Hong Kong] The coming end of ‘property hegemony’. Rising inequality and the deterioration of living conditions and standards among ordinary people – the alleged underlying sources of the 2019 unrest – have been blamed on the dominance of the real estate sector. Beijing may want the next chief executive to crack down – South China Morning Post
- [New Zealand] New Zealand house prices fall as interest rates and inflation weigh – Reuters
- [New Zealand] New Zealand house prices are starting to fall – but many buyers remain locked out. Some economists are predicting a 10% decrease over the year, but even that won’t return prices to those of two years ago – The Guardian
- [United Kingdom] Home Ownership and the UK Mortgage Market: An International Review – Institute for Global Change
- [United Kingdom] Stamp duty holiday tempted buyers into ‘marathon’ loans. Many homebuyers opted for mortgages of 35 years or more – The Guardian
- [United Kingdom] Breathing rooms: pollution and the property market. Air quality could become as important to homebuyers as price per square foot, proximity to schools and transport links – FT
On the US:
- The American property market is once again looking bubbly. Soaring mortgage rates have yet to cool exuberant demand – The Economist
- The housing market is running hot. Can the Fed cool it before it crashes? S&P Global considers 88% of U.S housing regions overvalued – Market Watch
- Early signs of cooling housing market seen in some U.S. cities, Redfin says – Reuters
- The new risk to the housing market – Politico
- What Higher Mortgage Rates Mean for the Housing Market.
Posted by at 5:00 AM
Labels: Global Housing Watch
Subscribe to: Posts