


Friday, December 16, 2022
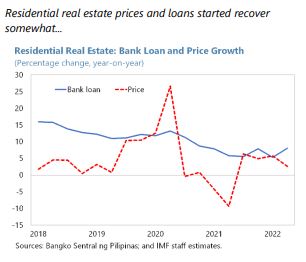
Housing Market in the Philippines
From the IMF’s latest report on the Philippines:
Posted by at 10:23 PM
Labels: Global Housing Watch
Housing View – December 16, 2022
On cross-country:
- Housing Market Stability and Affordability in Asia-Pacific – IMF
- Global house price fall underway won’t do much for affordability, say analysts – Reuters
- European house prices may be on the verge of falling, risk watchdog says – Reuters
- Cuatro acciones para reducir el déficit de vivienda mediante activos públicos – Inter-American Development Bank
On the US—housing forecasts for 2023
- 2023 Housing Forecasts – Calculated Risk
- Is The Housing Market Slowing Down: Redfin 2023 Predictions – Forbes
- What Does 2023 Hold for the Housing Market and Property Industry? – CoreLogic
- The Housing Market Will ‘Rebalance’ in 2023, Experts Predict. What That Means for You – Next Advisor
On the US—developments on house prices, rent, permits and mortgage:
- The Rent Control Bandwagon Rolls On – Cato
- Waiting for Home Prices to Drop? Bad Strategy. House prices may be declining in San Jose and Austin, but buyers looking in other markets won’t see much of a discount. – Bloomberg
- Housing Inflation Is Still Hot, But Mortgage Rates Could Ease Further – Barron’s
- Current State of the Housing Market; Overview for mid-December. A Sharp Decline in Sales, House Prices and Rents Falling – Calculated Risk
On the US—other developments:
- The American Dream Needs an Extensive Renovation. To address a worsening housing crisis, stop limiting supply and subsidizing the wrong kind of demand. – Bloomberg
- How Did the Housing Market Get So Unaffordable for So Many? Recent volatility in home prices and rents has been a long time coming. Fixing it will require abandoning outdated policy frameworks. – Wall Street Journal
- The Federal Reserve Is Deflating Financial Bubbles, Without a Crash. Cryptocurrencies, house prices and tech stocks are coming down. Financial strains so far seem contained, observers say – Bloomberg
- Mortgage Equity Withdrawal Still Solid in Q3. Homeowners now relying on Home Equity lines to extract equity – Calculated Risk
- Why the Dream of Turning Empty Offices Into Housing Is a Bust. Downtowns could use it, but that’s not enough. – Slate
- 2nd Look at Local Housing Markets in November. Another step down in sales in November – Calculated Risk
- Housing, Inflation and Why the Fed Should Consider a Pause – Calculated Risk
- Applications to Buy US Homes Rise as Mortgage Rates Hold Steady – Bloomberg
- Readout of White House Meeting with State Legislative Leaders on Housing Affordability – White House
- The Internet Made The Housing Market Less Rational – Real Estate Decoded
On China:
- How China’s Property Developers Got Into Such a Mess – Washington Post
On other countries:
- [France] Housing crisis prompts French students to escape to the country – The Guardian
- [Ireland] Increasing future housing supply: What are the implications for the Irish economy? – ESRI
- [Israel] Israeli lawmaker tables bill to limit banks raising mortgage rates – Reuters
- [Netherlands] Netherlands to Cap Rents of Thousands of Homes at $1,172. Over 300,000 homes will have their rent reduced by around €190. Landlords who charge too high rents will soon risk fines – Bloomberg
- [New Zealand] New Zealand house prices to bust then boom – Macro Business
- [New Zealand] New Zealand house prices fall as interest rates bite -REINZ – Reuters
- [Sweden] Sweden’s Free-Falling Property Market Triggers Worst Economic Slump in EU. Home values in Sweden are now down 15% from their peak. Commercial real estate has been identified as the main risk – Bloomberg
- [Sweden] Swedish Households Turn Gloomier on Outlook for Home Prices. Almost six in ten see more housing weakness in SEB survey. Most local forecasters expect 20% price slide from peak level – Bloomberg
- [United Kingdom] UK Home Asking Prices Are Falling at Sharpest Pace in Four Years. Buyers wait to see whether next year will bring more stability. Rightmove forecasts a 2% fall in asking prices over next year – Bloomberg
- [United Kingdom] The UK Housing Market Is at Risk of a Deep Freeze. A stalemate between sellers and buyers is likely — until and unless desperation sets in. – Bloomberg
- [United Kingdom] London’s house prices fall as all other regions rise. Average cost of UK home £33,000 higher in October than last year – FT
On cross-country:
- Housing Market Stability and Affordability in Asia-Pacific – IMF
- Global house price fall underway won’t do much for affordability, say analysts – Reuters
- European house prices may be on the verge of falling, risk watchdog says – Reuters
- Cuatro acciones para reducir el déficit de vivienda mediante activos públicos – Inter-American Development Bank
On the US—housing forecasts for 2023
- 2023 Housing Forecasts – Calculated Risk
- Is The Housing Market Slowing Down: Redfin 2023 Predictions – Forbes
- What Does 2023 Hold for the Housing Market and Property Industry?
Posted by at 5:00 AM
Labels: Global Housing Watch
Thursday, December 15, 2022
Housing Market Stability and Affordability in Asia-Pacific
From a new IMF Departmental Paper:
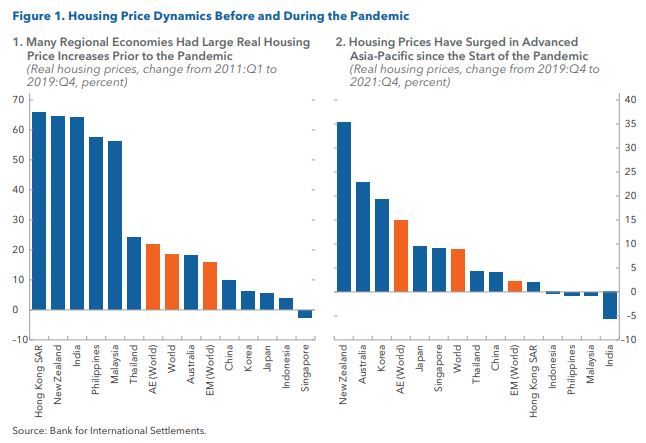
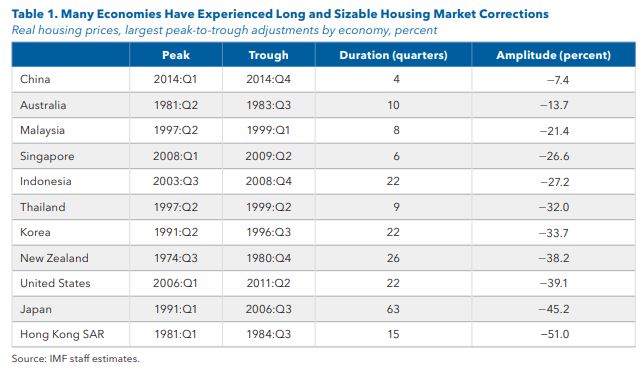
“Housing markets in the Asia-Pacific region are at an important juncture. Having risen over the past decade and during the pandemic, housing prices now appear slated for a decline in many countries. Pronounced housing cycles, which Asia-Pacific has experienced repeatedly also in the past, come at a cost. The buildup of vulnerabilities in the upswing tends to come to the fore during downturns, often with marked impacts on the broader economy. High housing prices and the prospect of increasing mortgage rates, as central banks tighten monetary policy, also imply a significant deterioration in housing affordability.
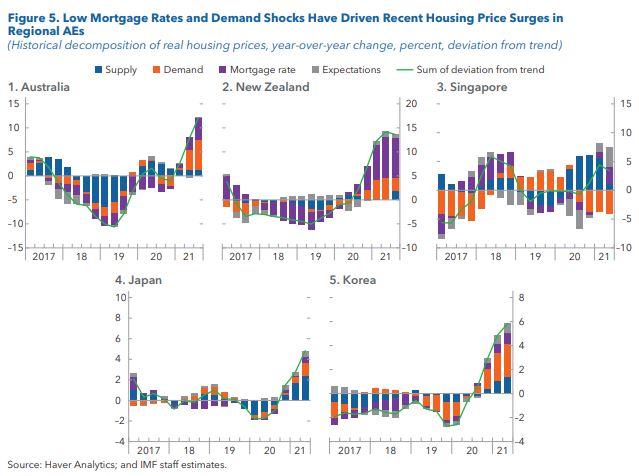
Housing prices in many countries across the region now appear misaligned, with significant downside risk to prices in the period ahead. Price surges during the pandemic, especially in the region’s advanced economies (AEs), were facilitated by low mortgage rates as central banks implemented very accommodative policy stances, along with country-specific demand and supply factors. This led to sizable price misalignment and a marked increase in downside risks to housing prices going forward, in the order of 5-20 percent in some countries. Rising interest rates will add to downside risks going forward. While the financial sectors of major AEs and emerging market economies (EMs) appear sound and would be expected to remain resilient under such shocks, close supervision is warranted for early identification of any pockets of risk.
With higher housing prices, housing affordability has become an increasing concern in the aftermath of the pandemic. Especially in the AEs, households have to stretch their wallets to be able to finance adequate housing, with an increasing share of them now overburdened by that cost. Adequate housing in many emerging market and developing economies (EMDEs) is also less affordable due to high housing prices, reflective of supply being unable to catch up with the rising demand of quickly growing populations. Poorer households in these countries are disproportionately affected.
To address the housing cycle and safeguard financial stability, macroprudential policies should be the first
line of defense. Countries in the Asia-Pacific region by now have a broad toolkit at their disposal, and policies have proven effective at mitigating housing credit growth during upswings. Within the toolkit, demand-side measures, such as loan to value (LTV) and debt service to total income (DSTI) limits, have been more effective than capital-based tools, and the effect of policy tightening during upswings has been generally stronger than stimulatory effects of policy loosening during downturns. While macroprudential measures have been effective at targeting household credit growth, they only have a limited effect on housing prices on average, and only significantly so in regional EMs. Leakages of macroprudential measures are also of concern, and policymakers should widen the regulatory perimeter where needed.
Improving housing affordability requires a multi-faceted policy approach. Facilitating a stronger supply
response will be key in many countries to address underlying imbalances. This includes reviewing land
use regulations, increasing the focus on urban planning, incentivizing the use of idle land, and providing
adequate social and affordable housing, both directly by the public sector and indirectly through incentives for private developers. But supply-side measures often take significant time to produce results, putting a premium on demand-side measures, which work more quickly. Such measures can include targeted government support, progressive taxation on property, targeted macroprudential policy to contain systemic risks while being mindful of its repercussions on lower-income households and owner-occupiers, and making use of targeted financing, insurance, and guarantee mechanisms.”
From a new IMF Departmental Paper:
“Housing markets in the Asia-Pacific region are at an important juncture. Having risen over the past decade and during the pandemic, housing prices now appear slated for a decline in many countries. Pronounced housing cycles, which Asia-Pacific has experienced repeatedly also in the past, come at a cost. The buildup of vulnerabilities in the upswing tends to come to the fore during downturns, often with marked impacts on the broader economy.
Posted by at 6:32 AM
Labels: Global Housing Watch
Housing Market in Namibia
From the IMF’s latest report on Namibia:
“Excessive loan concentration in the housing market could be a further factor constraining financial sector contribution to growth. More than 90 percent of household debt at end-2021 was in housing mortgages, representing half of all banking sector loans to the private sector. The concentration of credit provision in less productive sectors could make the growth contribution of the financial sector asymmetric, as observed in the data: limited potential for a positive contribution, but with the risk of a negative contribution during economic contractions. This risk is significant for households exposed to rising interest rates and declining real wages.”
From the IMF’s latest report on Namibia:
“Excessive loan concentration in the housing market could be a further factor constraining financial sector contribution to growth. More than 90 percent of household debt at end-2021 was in housing mortgages, representing half of all banking sector loans to the private sector. The concentration of credit provision in less productive sectors could make the growth contribution of the financial sector asymmetric, as observed in the data: limited potential for a positive contribution,
Posted by at 6:23 AM
Labels: Global Housing Watch
Saturday, December 10, 2022
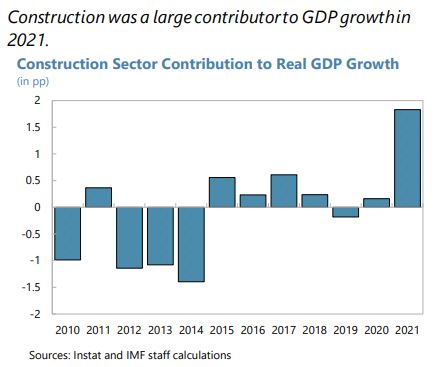
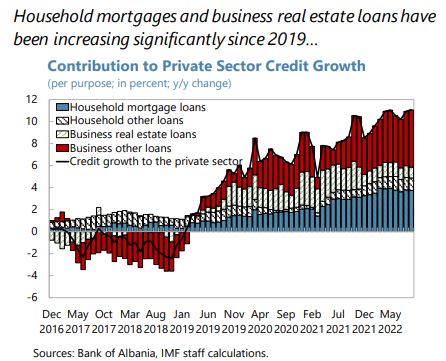
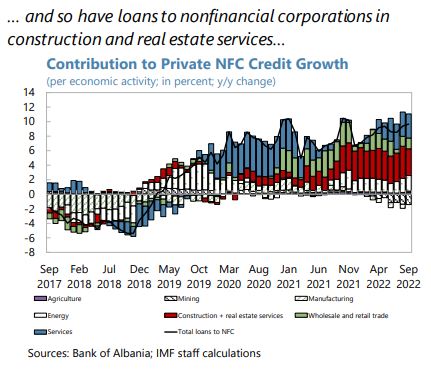
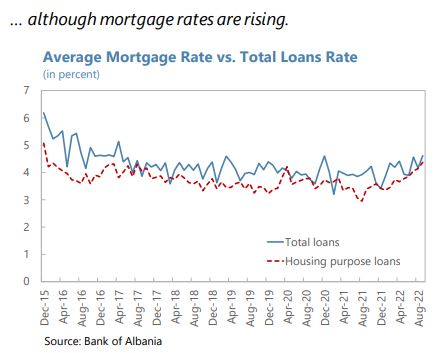
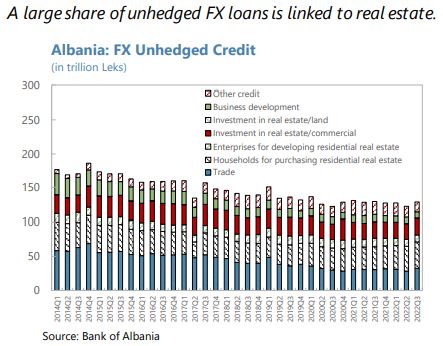
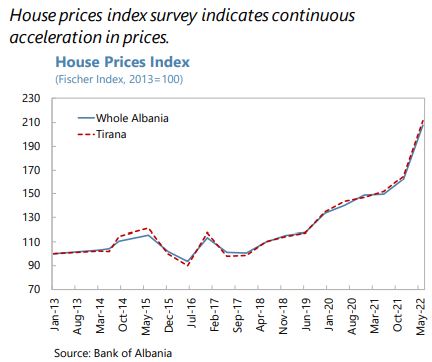
Housing Market in Albania
Posted by at 6:15 AM
Labels: Global Housing Watch
Subscribe to: Posts