


Tuesday, December 7, 2021
Housing Market in Albania
From the IMF’s latest report on Albania:
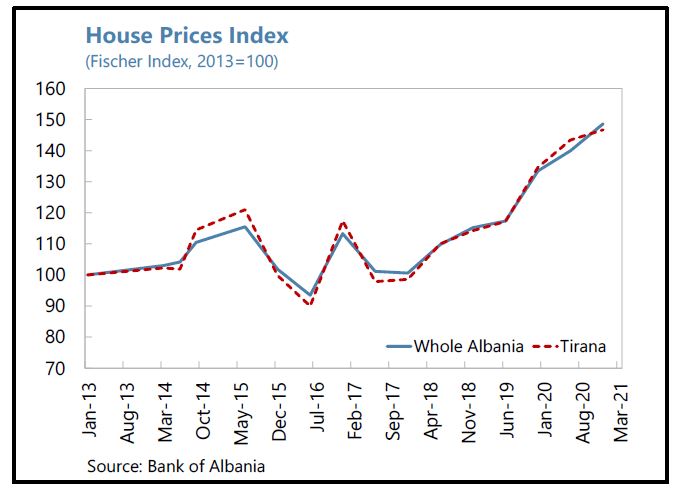
“Enhanced surveillance of the fast-growing real estate market is needed. Housing price growth has averaged 11 percent annually since 2018, driven by prices in Tirana and coastal areas. Mortgages account for 64 percent of household loans and construction loans account for 13 percent of total loans to enterprises. Staff encouraged the authorities to address data gaps in the real estate market and develop indicators to closely monitor the potential impact of the sector on financial stability.”
From the IMF’s latest report on Albania:
“Enhanced surveillance of the fast-growing real estate market is needed. Housing price growth has averaged 11 percent annually since 2018, driven by prices in Tirana and coastal areas. Mortgages account for 64 percent of household loans and construction loans account for 13 percent of total loans to enterprises. Staff encouraged the authorities to address data gaps in the real estate market and develop indicators to closely monitor the potential impact of the sector on financial stability.”
Posted by at 1:46 PM
Labels: Global Housing Watch
Race and Economic Well-Being in the United States
Abstract of this National Bureau for Economic Research (NBER) working paper (2021) by Jean-Felix Brouillette, Charles I. Jones, and Peter J. Klenow of Standford University:
“We construct a measure of consumption-equivalent welfare for Black and White Americans. Our statistic incorporates life expectancy, consumption, leisure, and inequality, with mortality rates playing a key role quantitatively. According to our estimates, welfare for Black Americans was 43% of that for White Americans in 1984 and rose to 60% by 2019. Going back further in time (albeit with more limited data), the gap was even larger, with Black welfare equal to just 28% of White welfare in 1940. On the one hand, there has been remarkable progress for Black Americans: the level of their consumption-equivalent welfare increased by a factor of 28 between 1940 and 2019 when aggregate consumption per person rose a more modest 5-fold. On the other hand, despite this remarkable progress, the welfare gap in 2019 remains disconcertingly large. Mortality from COVID-19 has temporarily reversed a decade of progress, lowering Black welfare by 17% while reducing White welfare by 10%.”
Click here to read the full paper.
Abstract of this National Bureau for Economic Research (NBER) working paper (2021) by Jean-Felix Brouillette, Charles I. Jones, and Peter J. Klenow of Standford University:
“We construct a measure of consumption-equivalent welfare for Black and White Americans. Our statistic incorporates life expectancy, consumption, leisure, and inequality, with mortality rates playing a key role quantitatively. According to our estimates, welfare for Black Americans was 43% of that for White Americans in 1984 and rose to 60% by 2019.
Posted by at 8:09 AM
Labels: Inclusive Growth
Monday, December 6, 2021
Real-Time Forecasting with a (Standard) Mixed-Frequency VAR During a Pandemic
New Paper by Frank Schorfheide & Dongho Song
“We resuscitated the mixed-frequency vector autoregression (MF-VAR) developed in Schorfheide
and Song (2015, JBES) to generate macroeconomic forecasts for the U.S. during the COVID-19
pandemic in real time. The model combines eleven time series observed at two frequencies:
quarterly and monthly. We deliberately did not modify the model specification in view of the
COVID-19 outbreak, except for the exclusion of crisis observations from the estimation sample.
We compare the MF-VAR forecasts to the median forecast from the Survey of Professional
Forecasters (SPF). While the MF-VAR performed poorly during 2020:Q2, subsequent forecasts
were at par with the SPF forecasts. We show that excluding a few months of extreme
observations is a promising way of handling VAR estimation going forward, as an alternative of a
sophisticated modeling of outliers.”
Read more here.
New Paper by Frank Schorfheide & Dongho Song
“We resuscitated the mixed-frequency vector autoregression (MF-VAR) developed in Schorfheide
and Song (2015, JBES) to generate macroeconomic forecasts for the U.S. during the COVID-19
pandemic in real time. The model combines eleven time series observed at two frequencies:
quarterly and monthly. We deliberately did not modify the model specification in view of the
COVID-19 outbreak, except for the exclusion of crisis observations from the estimation sample.
Posted by at 6:54 PM
Labels: Forecasting Forum
Housing Market in Australia
From the IMF’s latest report on Australia:
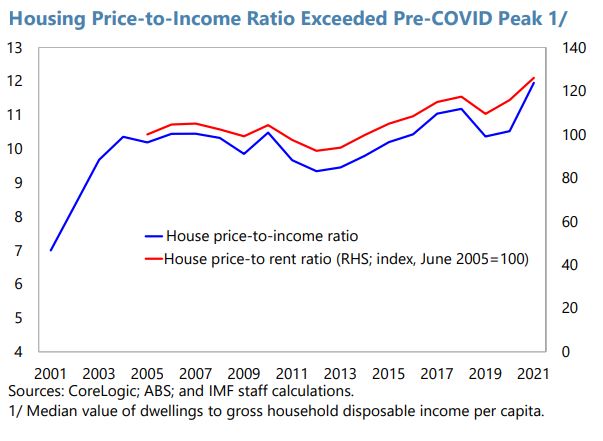
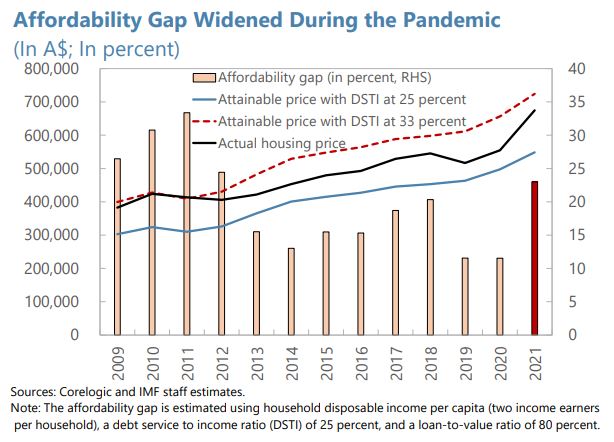
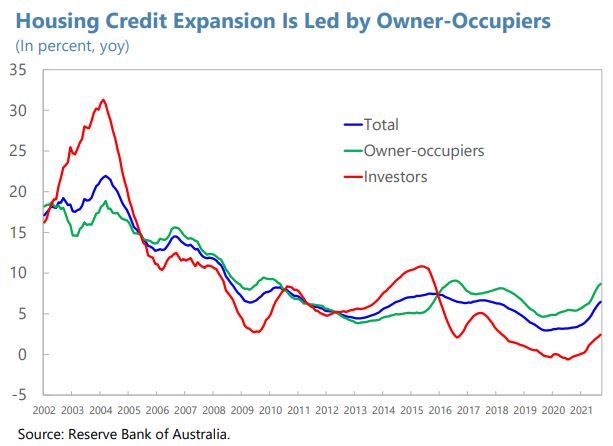
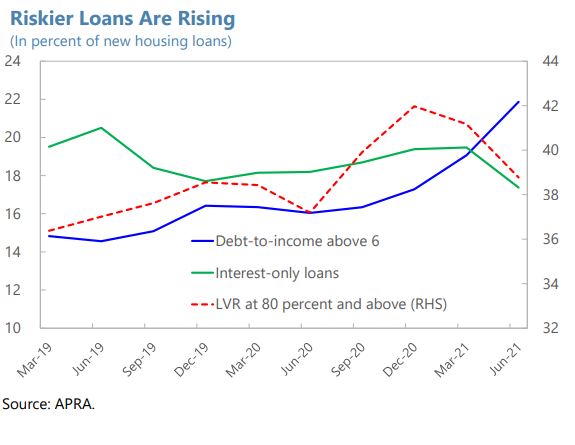
“Housing affordability has deteriorated, and financial risks are building. The housing price-to-income and price-to-rent ratios have risen and exceed pre-COVID peaks. The affordability gap has widened. Housing credit growth is accelerating, reaching 6.5 percent (y/y) in September, driven by owner-occupiers (8.7 percent), with investor loans picking up from a low base (2.4 percent). The risk profile of new loans is deteriorating, as the share of borrowers with high debt-to-income ratios surged from 16 percent pre-COVID to 22 percent.
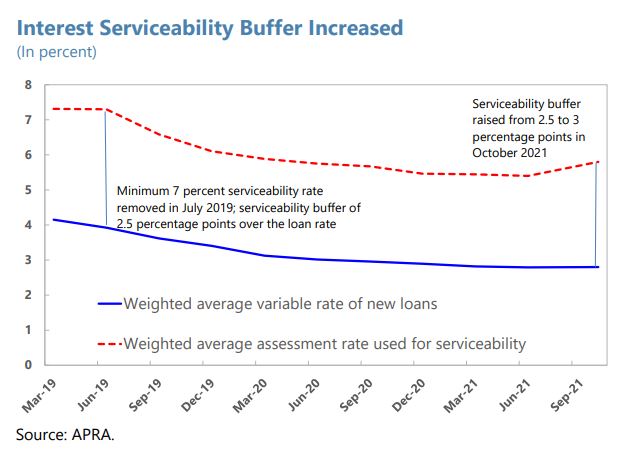
Macroprudential policy has responded to the changing risk environment. In October 2021, APRA raised the minimum serviceability buffer from 2.5 to 3 percent, requiring lenders to use the higher interest rate spread in assessing borrowers’ ability to service their mortgage loans, thereby strengthening their repayment capacity in case of shocks, such as rising interest rates or income loss.
Staff’s Views
The recent tightening of macroprudential policy is appropriate, and additional measures should be considered if financial-stability risks continue rising. While the surge in house prices has been driven largely by owner-occupiers taking advantage of low mortgage rates and fiscal support programs, high debt-to-income mortgages are on the rise amid elevated household debt, and investor demand has begun to increase from low levels. Lending standards should be monitored closely. With about 70 percent of mortgages at variable rates, borrowers are exposed to rate increases with the expected monetary policy normalization in the medium term. Further macroprudential tightening may be warranted if housing debt continues to outpace income growth and the rise in housing prices leads to increased riskiness of mortgage lending. Options include instituting portfolio restrictions on debt-to-income (DTI) and loan-to-value ratios (LVR), with DTI restrictions likely more effective in curbing investor demand, while LVR restrictions would affect more liquidity-constrained owner-occupiers, in particular first home buyers.
Housing structural reforms are critical for supporting affordability. Supply-side reforms, including more efficient planning, zoning, and better infrastructure, could improve housing supply. Commonwealth and state/territory governments should consider providing more financial incentives for local governments to streamline zoning regulations and improve infrastructure. Promoting flexible work arrangements could allow workers to move away from capital cities, improving affordability. In addition, governments should focus on providing targeted fiscal support for low-income households and expand social housing. This could be complemented by tax reforms to discourage leveraged housing investment.
Authorities’ Views
The authorities stressed that rising risks in home lending motivated the recent macroprudential tightening. They noted that, while lending standards have generally remained prudent, rapid credit growth that outpaces household income growth could build financial vulnerabilities, while the strength of the house price cycle could give rise to more risk-taking and potential erosion of lending standards. They underscored that they would continue to closely monitor trends in residential mortgage lending and were prepared to take further measures if needed. They confirmed that other policy instruments, including DTI and LVR restrictions, could be deployed if necessary. The authorities thought that tax policy was not the right tool to address potential speculative behavior in housing markets, as negative gearing and the capital gains tax discount apply across investments and investments in residential housing are relatively highly taxed, and that macroprudential policy should instead be employed as needed to address financial stability risks.
The authorities agreed that housing supply reform would be important to improve affordability. They highlighted that the Commonwealth has provided funds to support state and local governments in infrastructure provision and concurred that more could be done to promote zoning and planning reforms to boost housing supply. Additional targeted support could also be provided to low-income households to address affordability issues, and the authorities concurred that adequate provision of social housing remained important.”
From the IMF’s latest report on Australia:
“Housing affordability has deteriorated, and financial risks are building. The housing price-to-income and price-to-rent ratios have risen and exceed pre-COVID peaks. The affordability gap has widened. Housing credit growth is accelerating, reaching 6.5 percent (y/y) in September, driven by owner-occupiers (8.7 percent), with investor loans picking up from a low base (2.4 percent). The risk profile of new loans is deteriorating, as the share of borrowers with high debt-to-income ratios surged from 16 percent pre-COVID to 22 percent.
Posted by at 6:03 PM
Labels: Global Housing Watch
Are Your Greenhouse Gas Emissions All About Location, Location, Location?
From the Energy Institute at Haas:
“New research examines the role of individuals versus places in determining household carbon emissions.
The average household in San Francisco emits 36 percent less CO2 from residential and transportation energy use than the average household in Houston. Within the San Francisco Bay Area, the top 10 Census tracts with the highest household carbon emissions emit, on average, 5.6 times more per capita than the 10 lowest emissions Census tracts. Researchers and policy makers have recently highlighted the tremendous spatial variation in household carbon emissions, both within and across cities. See e.g. here and here.
Some of these differences can be explained by household characteristics, such as household size and income; some can be explained by gas versus electric heating or type of automobile. The remaining variation has historically been attributed to characteristics of the places themselves and how various amenities (e.g., climate, density, public transit, walkability) correlate with average carbon footprints.
This spatial variability could present an opportunity – perhaps we can learn from these places with low carbon footprints to better design and implement similar policies and practices nationwide in a quest to decarbonize the US economy.
A new paper by the Energy Institute’s own Eva Lyubich, available here as a new Energy Institute working paper, explores these issues in detail. The starting point of her paper is to recognize that people make choices about where they live, so different types of people live in different types of cities. Some people want to live in cities where they can drive to work, others prefer to commute via public transit or bike or walking. Some people want to live in a 3-bedroom house with a yard and others prefer an apartment building near lots of other people and restaurants. Through this lens, one quickly starts to realize that a lot of the differences we see in household carbon emissions across the US come from a mix of the characteristics of a particular place and the characteristics and preferences of people who choose to live there.”
Continue reading here.
From the Energy Institute at Haas:
“New research examines the role of individuals versus places in determining household carbon emissions.
The average household in San Francisco emits 36 percent less CO2 from residential and transportation energy use than the average household in Houston. Within the San Francisco Bay Area, the top 10 Census tracts with the highest household carbon emissions emit, on average, 5.6 times more per capita than the 10 lowest emissions Census tracts.
Posted by at 12:04 PM
Labels: Global Housing Watch
Subscribe to: Posts