


Tuesday, October 29, 2019
Geography of desperation in America
A Brookings piece based on a new paper by Carol Graham and Sergio Pinto:
“There is much to be troubled about in the state of America today. We boast booming stock markets and record low levels of unemployment, yet significant sectors of our society are dying prematurely from preventable deaths (deaths of despair) and almost 20% of prime aged males are out of the labor force.1 Americans have higher levels of well-being inequality and report more pain on average than countries of comparable and even lower levels of income. There are other signs of decline, ranging from falling levels of civic trust to viscerally divided politics.
These trends have already received significant scholarly attention. Yet we provide a different perspective by tracking the reported well-being and ill-being of individuals and places. We find large differences in these trends across education levels, races, and places. Desperation – and the associated trends in premature mortality – are concentrated among the less than college educated and are much higher among poor whites than poor minorities, who remain optimistic about their futures. The trends are also geographically dispersed, with racially and economically diverse urban and coastal places much more optimistic and with much lower incidences of premature mortality (on average). Both death and desperation are higher in the heartland and in particular in areas that were previously hubs for the manufacturing and mining jobs which have long since disappeared.
Our earlier work shows that the geographic patterns in lack of hope, worry, reported pain, reliance on disability insurance, and deaths of despair are remarkably consistent across these places. Monnat and Brown (2017) find that counties with higher levels of poverty, obesity, deaths due to drugs, alcohol, and suicide, more non-Hispanic whites, individuals on disability or other safety nets, and smokers were the same places where Trump “over-performed” in terms of predicted votes 2016.3
In this paper, we supplement what we know about these race and place-based trends with new research on the role of inter-generational mobility, prime aged individuals out in the labor force, and rural and micropolitan versus urban differences. We explore how patterns across these cohorts, races, and places associate with the worrisome trends in lack of hope and premature death. We also add in new indicators which assess financial, social, purpose, and community level well-being”
A Brookings piece based on a new paper by Carol Graham and Sergio Pinto:
“There is much to be troubled about in the state of America today. We boast booming stock markets and record low levels of unemployment, yet significant sectors of our society are dying prematurely from preventable deaths (deaths of despair) and almost 20% of prime aged males are out of the labor force.1 Americans have higher levels of well-being inequality and report more pain on average than countries of comparable and even lower levels of income.
Posted by at 12:12 PM
Labels: Inclusive Growth
Monday, October 28, 2019
Trade effects of 3D printing (that you didn’t hear about)
From VOX post by Caroline Freund, Alen Mulabdic, and Michele Ruta:
“The conventional wisdom is that 3D printing will shorten supply chains and reduce world trade. This column examines the trade effects of the shift to 3D printing in the production of hearing aids. It shows that adopting the new technology in production increased trade by roughly 60% as production costs came down. An analysis of 35 other products that are increasingly produced using 3D printing also finds positive effects but suggests that product characteristics such as bulkiness can affect the relationship between 3D printing and trade.
Will 3D printing disrupt world trade? The new technology has been accompanied by predictions of a future where goods will be printed locally, global supply chains will be shortened, and international trade will be dramatically reduced. Firms (and perhaps even consumers) will be able to create a solid three-dimensional object from a digital file and will no longer need to import printable goods and components. One study calculates that as much as 40% of trade could be eliminated by 2040 (Leering 2017). Other studies acknowledge that the impact of 3D printing on trade may be complex but still find that 3D printing and automation could lower world trade by 10% by 2030 (Lund and Bughin 2019).
In contrast, many earlier improvements in production processes that have reduced real costs have boosted international trade. The industrial revolution is perhaps the best example, where a transformation in technology and management practices brought huge productivity gains, output growth, and expanding trade. The digital revolution of the 1990s had a similar boosting effect on world trade through the rise of global supply chains (Baldwin 2016). The impact of 3D-printing technology on world trade is, therefore, an empirical question.
We address this question in a new paper (Freund et al. 2019), focusing on hearing aids, a product that since the mid-2000s has almost exclusively been produced with 3D printing. We then extend the analysis to 35 other products that are increasingly using 3D printing. The evidence suggests that firms (and countries) will continue to specialise and 3D printing will stimulate rather than hamper trade growth.
The 3D printing revolution in hearing aids
The good where 3D printing is most prevalent is hearing aids. Nearly 100% of all hearing aids consumed in the world are produced using 3D printing. 3D printers transformed the hearing aid industry in less than 500 days in the mid-2000s, which makes it a unique natural experiment to assess the trade effects of this technology (Figure 1).”
Figure 1 Adoption of 3D printing for custom hearing aids at Phonak
Source: Brans (2013)
Continue reading here.

From VOX post by Caroline Freund, Alen Mulabdic, and Michele Ruta:
“The conventional wisdom is that 3D printing will shorten supply chains and reduce world trade. This column examines the trade effects of the shift to 3D printing in the production of hearing aids. It shows that adopting the new technology in production increased trade by roughly 60% as production costs came down. An analysis of 35 other products that are increasingly produced using 3D printing also finds positive effects but suggests that product characteristics such as bulkiness can affect the relationship between 3D printing and trade.
Posted by at 10:59 AM
Labels: Inclusive Growth
Friday, October 25, 2019
Housing View – October 25, 2019
On cross-country:
- Part Two: How will we live in the 2020s? – Financial Times
- News-driven housing booms: Spain vs. Germany – EconPapers
On the US:
- Housing: It’s About More Than Money – NPR
- Untangling the Housing Shortage and Gentrification – Citylab
- Remodeling Market Expected to Stall in 2020 – Harvard Joint Center for Housing Studies
- Economists identify an unseen force holding back affordable housing – Seattle Times
- The missing housing boom – Axios
- The Mortgage Prepayment Decision: Are There Other Motivations Beyond Refinance and Move? – Federal Reserve Bank of Philadelphia
- Let’s get housing reform right this time – American Banker
- Is it time for American cities to stop growing? – VOX
- Will the housing market continue to prop up the US economy? – CNN
- Why Tax Changes Are Hurting the Housing Market – University of Pennsylvania
- Does Oregon Have the Answer to High Housing Costs? – Wall Street Journal
On other countries:
- [Hong Kong] Concerns raised Hong Kong’s housing reforms could overheat market – Financial Times
- [Hong Kong] Hong Kong Residential Market Survey – RICS-SPACIOUS
- [Portugal] Porto property prices rise at rapid rate – Financial Times
- [United Kingdom] Britain’s housing paradox: overcrowding and underoccupancy are both rising – The Economist
On cross-country:
- Part Two: How will we live in the 2020s? – Financial Times
- News-driven housing booms: Spain vs. Germany – EconPapers
On the US:
- Housing: It’s About More Than Money – NPR
- Untangling the Housing Shortage and Gentrification – Citylab
- Remodeling Market Expected to Stall in 2020 – Harvard Joint Center for Housing Studies
- Economists identify an unseen force holding back affordable housing – Seattle Times
- The missing housing boom – Axios
- The Mortgage Prepayment Decision: Are There Other Motivations Beyond Refinance and Move?
Posted by at 5:00 AM
Labels: Global Housing Watch
Thursday, October 24, 2019
The Phillips curve: Dead or alive
From VOX post by Peter Hooper, Frederic S. Mishkin, Amir Sufi:
“The apparent flattening of the Phillips curve has led some to claim that it is dead. The column uses data from US states and metropolitan areas to suggest a steeper slope, with non-linearities in tight labour markets. We have been here before – in the 1960s, similar low and stable inflation expectations led to the great inflation of the 1970s.
At a ‘Fed Listens’ event on 26 September 2019, Richard Clarida, vice chair of the Federal Reserve Board, observed that the flattening of the Phillips curve in recent decades is central to the Fed’s review of policy strategy (Clarida 2019). Price inflation has become much less responsive to resource slack, permitting the Fed to support employment during economic downturns more aggressively than it has in the past.
A flat Phillips curve reduces the chances of a breakout of inflation. This is especially important because the Fed considers the benefits of running a high-pressure economy, and of adopting a policy strategy that makes up for inflation misses to the downside by aiming for subsequent overshoots. Many participants in financial markets go even further than the Fed, believing that the Phillips curve is dead – in other words, excessive inflation is no longer a risk.
Recent experience in the US, Europe, and Japan appears to support this view. Major central banks struggle to get inflation to return to (or even move towards their objectives), even after labour markets have tightened. The US labour market has been running at or beyond estimates of full employment for the past two years, and inflation is still significantly below the Fed’s 2% target.
Indeed, measures of inflation expectations have been drifting lower, not higher as the Phillips curve model would predict. So is this model really dead, or just dormant? If not dead, how can we explain the flattening of the Phillips curve? What might reverse this trend, leading to a resurgence of inflation?
A lot of empirical research has been devoted to these questions over the past decade, for example Yellen (2015), Kiley (2015) Blanchard (2016), Nalewaik (2016), Powell (2018), and Hooper et al. (2019). We know that the Phillips curve was alive and well during the 1950s through the 1970s, and into the 1980s at the national level. Prices and wages showed significant sensitivity to movements in unemployment during this period. These sensitivities increased when the labour market tightened beyond full employment, indicating a nonlinear relationship. Policymakers allowed the labour market to tighten well beyond full employment levels for a sustained period during the 1960s and, at first, inflation remained low and stable. But several years of tight labour markets resulted in the great inflation of the 1970s.
Since the late 1980s, however, there has been only weak evidence of the sensitivity and nonlinearity of the response of inflation to labour market tightening. Efforts to estimate statistically significant price Phillips curve models using national data have generally failed.
Is the Phillips curve dead?
In a recent paper (Hooper et al. 2019), we argue that there are three reasons why the evidence for a dead Phillips curve is weak.”
Continue reading here.
From VOX post by Peter Hooper, Frederic S. Mishkin, Amir Sufi:
“The apparent flattening of the Phillips curve has led some to claim that it is dead. The column uses data from US states and metropolitan areas to suggest a steeper slope, with non-linearities in tight labour markets. We have been here before – in the 1960s, similar low and stable inflation expectations led to the great inflation of the 1970s.
Posted by at 10:00 AM
Labels: Macro Demystified
Monday, October 21, 2019
Understanding the rise in second-home buying
Global Housing Watch Newsletter: October 2019
In this interview, Daniel Garcia talks about his new paper: Second-Home Buying and the Housing Boom and Bust. Daniel Garcia is an economist at the Federal Reserve.
Disclaimer: The views expressed in this Q&A are those of the author, and do not reflect the views of the Federal Reserve Board or the Federal Reserve System.
Hites Ahir: What prompted you to work on this project?
Daniel Garcia: I read a paper by Neil Bhutta (2015), where he documents that existing homeowners contributed more to the rise in aggregate mortgage debt during the housing boom than all first-time borrowers, subprime and otherwise.[1] Neil’s paper showed the housing boom on the borrower side was to a large extent driven by individuals who were already homeowners – and were typically above-average in income and credit scores – rather than by borrowers becoming first time homeowners. I felt that understanding the effects of the rise in second-home buying (existing homeowners acquiring additional properties) was important macro-prudentially and a bit understudied.
Hites Ahir: How do experts measure second-home buying?
Daniel Garcia: The most reliable measure comes from anonymized credit bureau data, such as the Federal Reserve Bank of New York/Equifax Consumer Credit Panel dataset, which allows researchers to impute second-home buying based on the number of first-lien mortgages in individual’s credit files. One issue with credit bureau records is they do not contain the address of nonprimary residences. I therefore supplement my analysis with the Credit Risk Insight Servicing McDash (CRISM) dataset, a merge done by Equifax of their credit bureau records with a loan-level dataset containing property address (McDash).
Hites Ahir: How much was the increase in second-home buying during the 2000-06 period?
Daniel Garcia: In the Federal Reserve Bank of New York/Equifax Consumer Credit Panel dataset, the share of new home purchase loans going to existing homeowners rose from about 20 to almost 40 percent from 2000 to 2006. In other words, close to 4 in 10 purchase mortgages went to existing homeowners at the peak of the housing boom in 2006. Since the housing crash, the share of purchase mortgages going to existing homeowners is back around 20 percent (Figure 1).
Figure 1: The share of new loans for non-primary residences
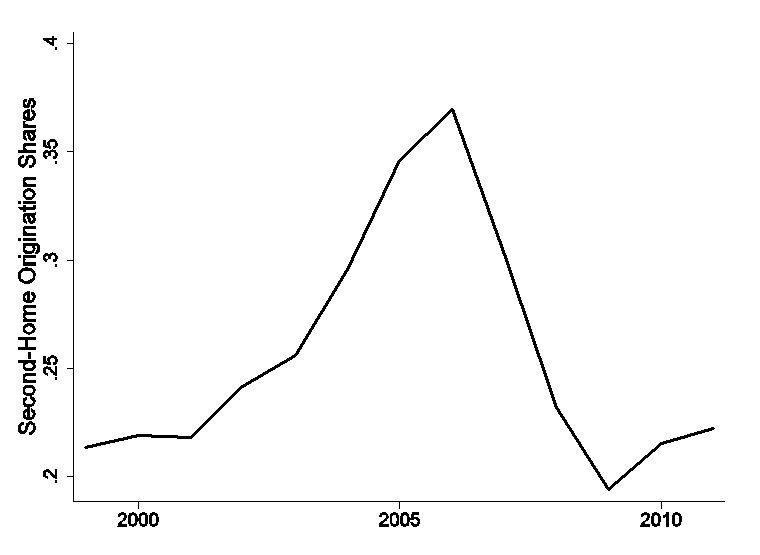
Note: The figure plots the aggregate second-home origination (new loans for nonprimary residences) share by year. Source: Federal Reserve Bank of New York/Equifax Consumer Credit Panel dataset and author’s calculations.
Hites Ahir: What was driving the increase?
Daniel Garcia: Rising fundamentals in the late 1990s expansion seem an important part of the story. Locals of areas where house prices and wages grew more in the late 1990s were on average more likely to buy additional properties in the mid-2000s than elsewhere. That said, improving fundamentals are likely not the full story, because other expansions did not produce such a strong increase in second-home buying. It is likely that improving fundamentals in the late 1990s interacted with other changes in the economy, such as optimistic beliefs about house prices and easier credit conditions, to generate the increase in second-home buying.
Hites Ahir: How did the rise in second-home buying affect the economy?
Daniel Garcia: The strong rise in second-home buying could have had important macroeconomic implications, contributing to housing mispricing and over-construction during the boom and the rise in foreclosures during the recession, as argued by others such as Haughwout et al (2011); Chinco and Mayer (2019); Albanesi et al (2019). However, disentangling causality is challenging, as the rise in second-home buying could have been a symptom rather than a cause of other economic forces, such as overly optimistic beliefs about house prices.
To estimate the causal effects, I focus on vacation areas, which I measure based on the vacation share of housing from the 2000 decennial census. I argue they offer an ideal laboratory – vacation areas experienced a stronger rise in second-home buying during the boom than elsewhere, reflecting factors originating elsewhere such as rising income, house prices, and demand for second homes in other parts of the country. Because of the relatively stronger rise in second-home buying there, vacation areas experienced more pronounced boom-bust episodes: house prices and construction employment grew more quickly than elsewhere during the mid -2000s and crashed more sharply during the recession (Figure 2).
In the paper, I verify that the sharp boom-bust in vacation areas was caused by changes in demand for second homes originating elsewhere, rather than by local developments, by ruling out alternative explanations. For example, vacation areas were otherwise ordinary across various other boom indicators, such as the use of alternative mortgages, private-label securitization, changes in mortgage debt by locals, pre-trends in income and house prices, supply constraints, and credit scores. Moreover, all of the stronger increase in second-home buying there was explained by purchases from out-of-town buyers.
Figure 2: House Prices and Construction Employment in Vacation vs Other Areas
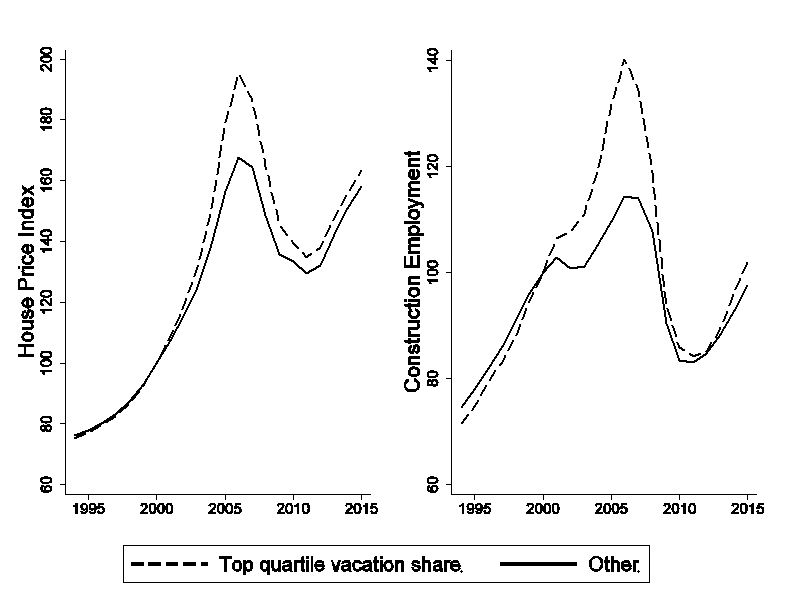
Note: The figure plots house prices against time for two groups: the top quartile of vacation shares in the 2000 census, and the other counties. House prices and construction employment are indexed to equal 100 in the year 2000. Source: 2000 Census, CoreLogic HPI and Quarterly Census of Employment and Wages.
Hites Ahir: Why focus on vacation areas, and are estimates based on those areas likely to be representative?
Daniel Garcia: Housing in vacation areas allows us to estimate the causal effects of changes in second-home buying. Other parts of the country, such as cities in the sand states such as Los Angeles, Phoenix, and Las Vegas, also had high second-home buying, but also high private-label securitization, use of alternative mortgages, and increases in household debt, making it challenging to isolate the effects of second-home buying there. The appeal of vacation areas is we can confidently isolate the effects of second-home buying there.
That said, the effects of second-home buying in vacation areas are likely informative of the overall effects, because second-home buying in vacation areas was broadly representative: most of the second-home purchases there were for individuals acquiring their second or third property (about 85 percent of all second-home purchases during the boom), but also included second-home buying by borrowers with 4 or more houses, a segment of the market more likely to consist of property investors. Therefore, I interpret the main findings of the paper as informative of second-home buying overall.
Hites Ahir: What are the implications of your findings?
Daniel Garcia: The findings suggest changes in credit demand amplified the housing boom and bust. Vacation areas had a stronger housing boom and bust caused by the rise in demand for second homes in other parts of the country. It is unlikely that credit supply developments explained the boom-bust in those areas, as mortgages for vacation area properties were average in the use of alternative (such as interest-only) mortgages and private-label securitization.
Though the findings highlight the role of changes in credit demand, they are consistent with credit supply mattering elsewhere in the aggregate, as found by others (e.g. Mian and Sufi 2009; Demyanyk and Hemert 2011) including some of my own previous work (Garcia 2018). My view is that outward shifts in both credit supply and demand helped cause the housing boom and bust, likely anchored by common factors such as overly optimistic beliefs on house prices, as argued by others such as Burnside et al (2016), Piazzesi and Schneider (2016), and Kaplan et al. (2017).
Hites Ahir: What is the current state of second-home buying in the United States?
Daniel Garcia: For individuals, the share of second-home purchase shares has remained around 20 percent since the recession. The corporate share of home purchases was around 11 percent at the end of 2019, up a few percentage points from 2016 according to data from CoreLogic. Therefore, the scene appears somewhat quieter than in other countries such as the United Kingdom, Canada, and Australia, where recent rises in out-of-town buying have been more pronounced.
[1] Sometimes second-home buyers are referred to as property investors. I use the term “second-home buyers” instead, to distinguish between individual buyers from corporate investors. Moreover, many second-home purchases by individuals likely had a consumption motive – about 85 percent of all second-home purchases by individuals during the housing boom were for a second or third property.
Global Housing Watch Newsletter: October 2019
In this interview, Daniel Garcia talks about his new paper: Second-Home Buying and the Housing Boom and Bust. Daniel Garcia is an economist at the Federal Reserve.
Disclaimer: The views expressed in this Q&A are those of the author, and do not reflect the views of the Federal Reserve Board or the Federal Reserve System.
Posted by at 5:00 AM
Labels: Global Housing Watch
Subscribe to: Posts