Monday, October 21, 2019
Understanding the rise in second-home buying
Global Housing Watch Newsletter: October 2019
In this interview, Daniel Garcia talks about his new paper: Second-Home Buying and the Housing Boom and Bust. Daniel Garcia is an economist at the Federal Reserve.
Disclaimer: The views expressed in this Q&A are those of the author, and do not reflect the views of the Federal Reserve Board or the Federal Reserve System.
Hites Ahir: What prompted you to work on this project?
Daniel Garcia: I read a paper by Neil Bhutta (2015), where he documents that existing homeowners contributed more to the rise in aggregate mortgage debt during the housing boom than all first-time borrowers, subprime and otherwise.[1] Neil’s paper showed the housing boom on the borrower side was to a large extent driven by individuals who were already homeowners – and were typically above-average in income and credit scores – rather than by borrowers becoming first time homeowners. I felt that understanding the effects of the rise in second-home buying (existing homeowners acquiring additional properties) was important macro-prudentially and a bit understudied.
Hites Ahir: How do experts measure second-home buying?
Daniel Garcia: The most reliable measure comes from anonymized credit bureau data, such as the Federal Reserve Bank of New York/Equifax Consumer Credit Panel dataset, which allows researchers to impute second-home buying based on the number of first-lien mortgages in individual’s credit files. One issue with credit bureau records is they do not contain the address of nonprimary residences. I therefore supplement my analysis with the Credit Risk Insight Servicing McDash (CRISM) dataset, a merge done by Equifax of their credit bureau records with a loan-level dataset containing property address (McDash).
Hites Ahir: How much was the increase in second-home buying during the 2000-06 period?
Daniel Garcia: In the Federal Reserve Bank of New York/Equifax Consumer Credit Panel dataset, the share of new home purchase loans going to existing homeowners rose from about 20 to almost 40 percent from 2000 to 2006. In other words, close to 4 in 10 purchase mortgages went to existing homeowners at the peak of the housing boom in 2006. Since the housing crash, the share of purchase mortgages going to existing homeowners is back around 20 percent (Figure 1).
Figure 1: The share of new loans for non-primary residences
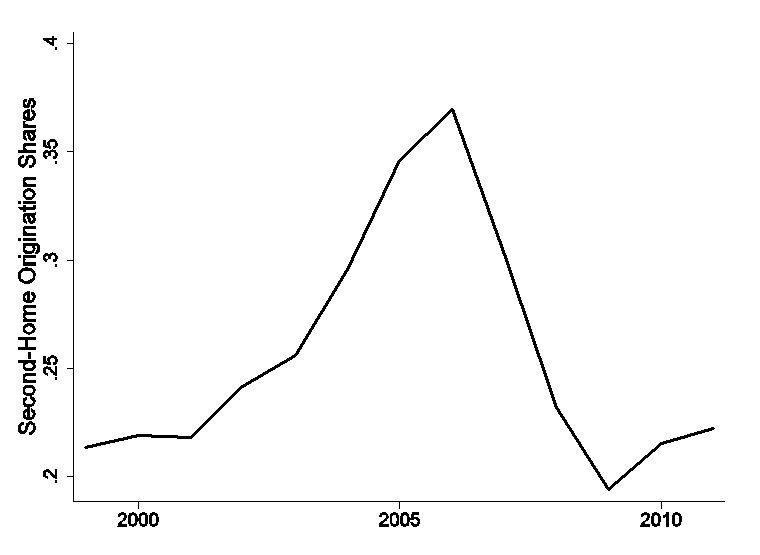
Note: The figure plots the aggregate second-home origination (new loans for nonprimary residences) share by year. Source: Federal Reserve Bank of New York/Equifax Consumer Credit Panel dataset and author’s calculations.
Hites Ahir: What was driving the increase?
Daniel Garcia: Rising fundamentals in the late 1990s expansion seem an important part of the story. Locals of areas where house prices and wages grew more in the late 1990s were on average more likely to buy additional properties in the mid-2000s than elsewhere. That said, improving fundamentals are likely not the full story, because other expansions did not produce such a strong increase in second-home buying. It is likely that improving fundamentals in the late 1990s interacted with other changes in the economy, such as optimistic beliefs about house prices and easier credit conditions, to generate the increase in second-home buying.
Hites Ahir: How did the rise in second-home buying affect the economy?
Daniel Garcia: The strong rise in second-home buying could have had important macroeconomic implications, contributing to housing mispricing and over-construction during the boom and the rise in foreclosures during the recession, as argued by others such as Haughwout et al (2011); Chinco and Mayer (2019); Albanesi et al (2019). However, disentangling causality is challenging, as the rise in second-home buying could have been a symptom rather than a cause of other economic forces, such as overly optimistic beliefs about house prices.
To estimate the causal effects, I focus on vacation areas, which I measure based on the vacation share of housing from the 2000 decennial census. I argue they offer an ideal laboratory – vacation areas experienced a stronger rise in second-home buying during the boom than elsewhere, reflecting factors originating elsewhere such as rising income, house prices, and demand for second homes in other parts of the country. Because of the relatively stronger rise in second-home buying there, vacation areas experienced more pronounced boom-bust episodes: house prices and construction employment grew more quickly than elsewhere during the mid -2000s and crashed more sharply during the recession (Figure 2).
In the paper, I verify that the sharp boom-bust in vacation areas was caused by changes in demand for second homes originating elsewhere, rather than by local developments, by ruling out alternative explanations. For example, vacation areas were otherwise ordinary across various other boom indicators, such as the use of alternative mortgages, private-label securitization, changes in mortgage debt by locals, pre-trends in income and house prices, supply constraints, and credit scores. Moreover, all of the stronger increase in second-home buying there was explained by purchases from out-of-town buyers.
Figure 2: House Prices and Construction Employment in Vacation vs Other Areas
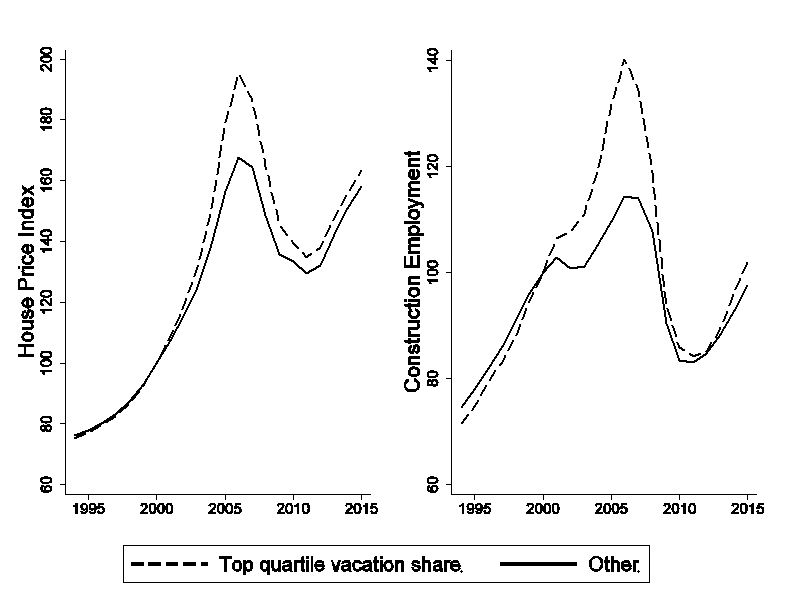
Note: The figure plots house prices against time for two groups: the top quartile of vacation shares in the 2000 census, and the other counties. House prices and construction employment are indexed to equal 100 in the year 2000. Source: 2000 Census, CoreLogic HPI and Quarterly Census of Employment and Wages.
Hites Ahir: Why focus on vacation areas, and are estimates based on those areas likely to be representative?
Daniel Garcia: Housing in vacation areas allows us to estimate the causal effects of changes in second-home buying. Other parts of the country, such as cities in the sand states such as Los Angeles, Phoenix, and Las Vegas, also had high second-home buying, but also high private-label securitization, use of alternative mortgages, and increases in household debt, making it challenging to isolate the effects of second-home buying there. The appeal of vacation areas is we can confidently isolate the effects of second-home buying there.
That said, the effects of second-home buying in vacation areas are likely informative of the overall effects, because second-home buying in vacation areas was broadly representative: most of the second-home purchases there were for individuals acquiring their second or third property (about 85 percent of all second-home purchases during the boom), but also included second-home buying by borrowers with 4 or more houses, a segment of the market more likely to consist of property investors. Therefore, I interpret the main findings of the paper as informative of second-home buying overall.
Hites Ahir: What are the implications of your findings?
Daniel Garcia: The findings suggest changes in credit demand amplified the housing boom and bust. Vacation areas had a stronger housing boom and bust caused by the rise in demand for second homes in other parts of the country. It is unlikely that credit supply developments explained the boom-bust in those areas, as mortgages for vacation area properties were average in the use of alternative (such as interest-only) mortgages and private-label securitization.
Though the findings highlight the role of changes in credit demand, they are consistent with credit supply mattering elsewhere in the aggregate, as found by others (e.g. Mian and Sufi 2009; Demyanyk and Hemert 2011) including some of my own previous work (Garcia 2018). My view is that outward shifts in both credit supply and demand helped cause the housing boom and bust, likely anchored by common factors such as overly optimistic beliefs on house prices, as argued by others such as Burnside et al (2016), Piazzesi and Schneider (2016), and Kaplan et al. (2017).
Hites Ahir: What is the current state of second-home buying in the United States?
Daniel Garcia: For individuals, the share of second-home purchase shares has remained around 20 percent since the recession. The corporate share of home purchases was around 11 percent at the end of 2019, up a few percentage points from 2016 according to data from CoreLogic. Therefore, the scene appears somewhat quieter than in other countries such as the United Kingdom, Canada, and Australia, where recent rises in out-of-town buying have been more pronounced.
[1] Sometimes second-home buyers are referred to as property investors. I use the term “second-home buyers” instead, to distinguish between individual buyers from corporate investors. Moreover, many second-home purchases by individuals likely had a consumption motive – about 85 percent of all second-home purchases by individuals during the housing boom were for a second or third property.
Posted by at 5:00 AM
Labels: Global Housing Watch
Subscribe to: Posts