


Friday, March 15, 2019
Housing View – March 15, 2019
On cross-country:
- Global House Price Index-Q4 2018 – Knight Frank
- Prices of prime properties around the world are falling – Economist
- Strengthening economic case for housing policies – UNSW
- Political crosswinds buffet global real estate – Financial Times
On the US:
- Beautiful City: Leisure Amenities and Urban Growth – Federal Reserve Bank of Philadelphia
- Do the Poor Pay More for Housing? Exploitation, Profit, and Risk in Rental Markets – American Journal of Sociology
- The Eighth Edition of the First-Time Homebuyer Market Report – Genworth Mortgage Insurance
- After falling to yearly lows, mortgage rates head back up – Washington Post
- HPSI Flat as Continued Economic Optimism Offset by Softening Housing Attitudes – Fannie Mae
- Gavin Newsom Called This City Out on Affordable Housing. Its Leaders Weren’t Mad. – New York Times
- Here’s why San Francisco housing prices could soon get even crazier – MarketWatch
- To deal with high housing costs, more married couples are taking in roommates – Washington Post
- Oregon Will Learn Painful Housing Lessons – Wall Street Journal
- The Libertarian, with Richard Epstein: “Rent Control, Housing, and Economics – Hoover Institution
- Zoning, density, and rising housing prices: A case study in Portland, Oregon – SAGE Journals
- The Tiny House Solution: Accessory Dwelling Units as a Housing Market Fix – Kennedy School Review
- Experts: Gov’t Should Work to Lessen Natural Disaster Losses, Not Insure Them – Zillow
- Buyers Finally Get the Upper Hand in Hottest U.S. Housing Markets – Bloomberg
- High-end home buyers drive mortgage applications higher – Financial Times
On other countries:
- [Australia] Why It’s Getting Even Harder to Get a Mortgage in Australia – Bloomberg
- [Australia] Chinese Buyers Helped Boost Australian Home Prices. Now They’re Leaving – Bloomberg
- [Australia] A Model of the Australian Housing Market – Reserve Bank of Australia
- [Brazil] Slums in Brazil: Where are They Located, Who Lives in Them, and Do They ‘Squeeze’ the Formal Housing Market? – Journal of Housing Economics
- [China] Party on: Real estate booms in cradle of China’s Communist revolution – Reuters
- [Netherlands] Netherlands’ house price rises accelerating – Global Property Guide
- [Spain] Blackstone Hit by Spain Rental Cap as Populists Push Agenda – Bloomberg
- [United Kingdom] Why British housebuilders are making such juicy profits – Economist
On cross-country:
- Global House Price Index-Q4 2018 – Knight Frank
- Prices of prime properties around the world are falling – Economist
- Strengthening economic case for housing policies – UNSW
- Political crosswinds buffet global real estate – Financial Times
On the US:
- Beautiful City: Leisure Amenities and Urban Growth – Federal Reserve Bank of Philadelphia
- Do the Poor Pay More for Housing?
Posted by at 5:00 AM
Labels: Global Housing Watch
Wednesday, March 13, 2019
Optimising Production: Industrial Policies in Networks
From a new VoxChina post:
“Many developing countries adopt industrial policies favoring upstream sectors. Liu (2018) shows these policies might enhance aggregate production efficiency. When sectors form a production network, market imperfections generate distortions that compound through input demand linkages, accumulating into upstream sectors and creating an incentive for well-meaning governments to subsidize these sectors. The study proposes the measure “distortion centrality,” which is a sufficient statistic that can guide policy interventions in arbitrary networks. Distortion centrality predicts sectors that were promoted in South Korea in the 1970s and modern-day China, suggesting that these policies might have generated positive aggregate effects.”
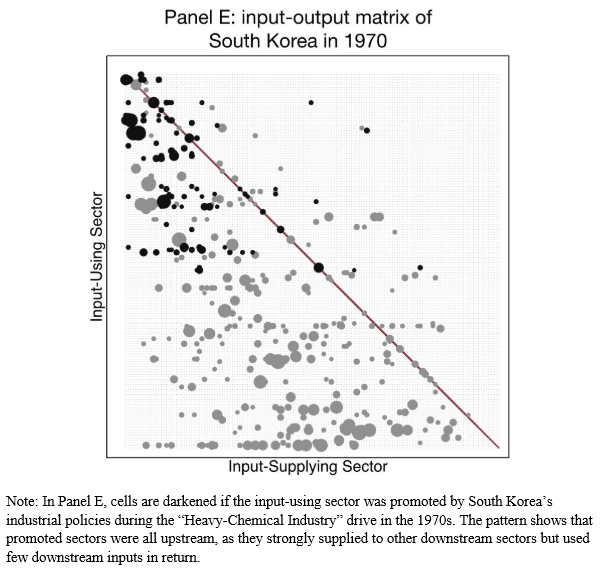
“I find that the heavy and chemical sectors promoted by South Korea in the 1970s were upstream (as visibly evident from Figure 2E) and had significantly higher distortion centrality than non-targeted sectors, suggesting that government interventions contributed positively to aggregate economic performance.
In modern-day China, non-state-owned firms in sectors with higher distortion centrality have significantly better access to loans, receive more favourable interest rates, and pay lower taxes. These sectors also tend to have more state-owned enterprises, to which the government directly extends credit and policy subsidies.
My quantitative analysis reveals that in China, differential sectoral interest rates, tax incentives, and funds given to state-owned enterprises all generate positive aggregate effects and, taken together, improve aggregate efficiency by 4.8%. Moreover, distortion centrality correlates negatively with sectoral size, suggesting that promoting large sectors would lead to aggregate losses.”
From a new VoxChina post:
“Many developing countries adopt industrial policies favoring upstream sectors. Liu (2018) shows these policies might enhance aggregate production efficiency. When sectors form a production network, market imperfections generate distortions that compound through input demand linkages, accumulating into upstream sectors and creating an incentive for well-meaning governments to subsidize these sectors. The study proposes the measure “distortion centrality,” which is a sufficient statistic that can guide policy interventions in arbitrary networks.
Posted by at 2:46 PM
Labels: Inclusive Growth
Confronting Inequality: How Societies Can Choose Inclusive Growth
Posted by at 8:53 AM
Labels: Inclusive Growth
Tuesday, March 12, 2019
Sources of US Greenhouse Gas Emissions
From a new post by Timothy Taylor:
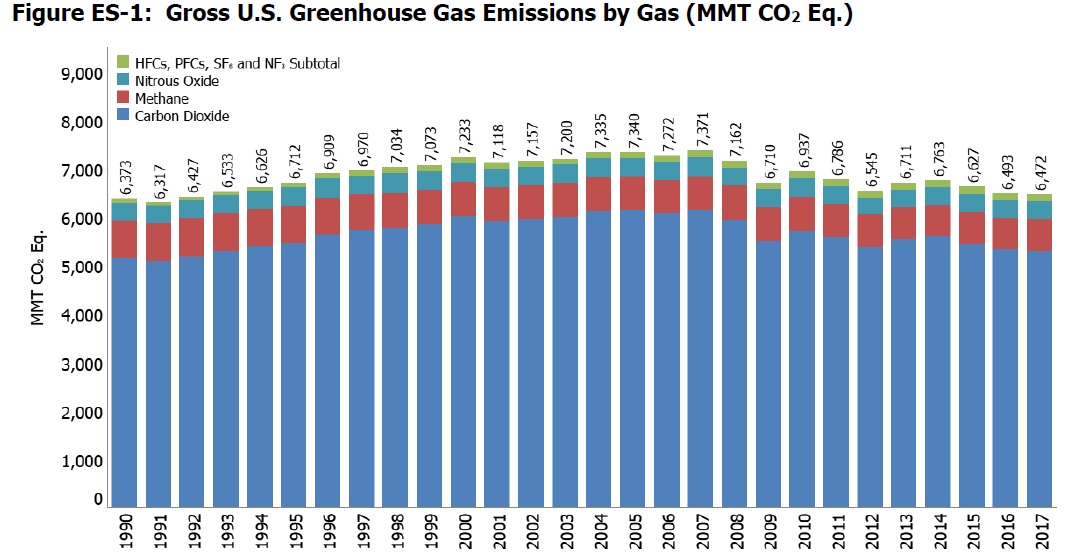
“Each year the Environmental Protection Agency produces an Inventory of U.S. Greenhouse Gas Emissions and Sinks. The draft version of the report for 1990-2017 was published in February 2019.
Here’s a figure showing gross emissions of greenhouse gases in the US. Emissions that are not carbon dioxide have been converted to its “equivalent.”
Several themes jump out from the figure. One is that the overwhelming share of emissions are plain old carbon dioxide, rather than methane or other gases. Another is that the total emissions have been dropping in the last few years, and are more-or-less back to 1990 levels, which one can interpret either through the lens of “could be worse” or “should be better,” as you are so inclined.
Given the predominance of carbon dioxide emissions, let’s dig into those a little deeper. Most of the carbon dioxide emissions come from burning fossil fuels. This table shows the breakdown into a few main sectors.
Total US emissions of greenhouse gases in 2017 were 6472 million metric tons of carbon dioxide-equivalent. Thus, transportation and the electric power sector combined account for more than half of all emissions. It seems to me both appropriate to focus on reducing emissions in those sectors, but also to remember that, combined, they are only about half of the problem. Emissions from industrial, residential, and commercial activities are also pretty significant.
Moreover, methane emissions landfill, leakages in natural gas systems, and the digestive tracts of livestock make up the equivalent of 449 million metric tons of carbon dioxide emissions in 2017. Agricultural soil management released nitrogen oxides that are the equivalent of 266 million metric tons of carbon dioxide in 2017, roughly equivalent to fossil fuel-related carbon emissions from the residential or the commercial sector. Hydrofluorocarbons that are being used to to replace ozone-depleting substances account for another 152 million metric tons of CO2-equivalent emissions.

This EPA report is a tabulation of greenhouse gas emissions. It isn’t about questions of how emissions of greenhouse gases might affect climate, or estimating economics costs from changes in climate, or about what methods of addressing greenhouse gas emissions are likely to be more or less cost-effective. For discussions of these points, I recommend a three-paper “Symposium on Climate Change” in the Fall 2018 issue of the Journal of Economic Perspectives. (Full disclosure: My actual paid job, as opposed to my blogging avocation, is Managing Editor of the JEP.) The papers are:
- “An Economist’s Guide to Climate Change Science,” by Solomon Hsiang and Robert E.Kopp
- “Quantifying Economic Damages from Climate Change.” by Maximilian Auffhammer
- “The Cost of Reducing Greenhouse Gas Emissions,” by Kenneth Gillingham and James H.Stock”
From a new post by Timothy Taylor:
“Each year the Environmental Protection Agency produces an Inventory of U.S. Greenhouse Gas Emissions and Sinks. The draft version of the report for 1990-2017 was published in February 2019.
Here’s a figure showing gross emissions of greenhouse gases in the US. Emissions that are not carbon dioxide have been converted to its “equivalent.”
Several themes jump out from the figure.
Posted by at 6:43 PM
Labels: Forecasting Forum
Housing Market in Belgium
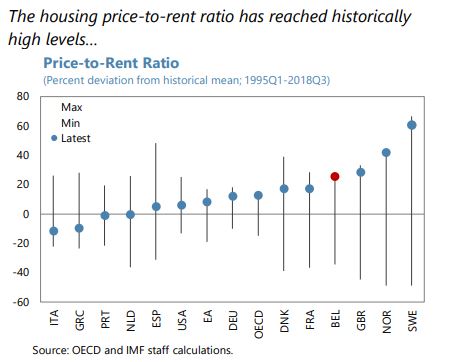
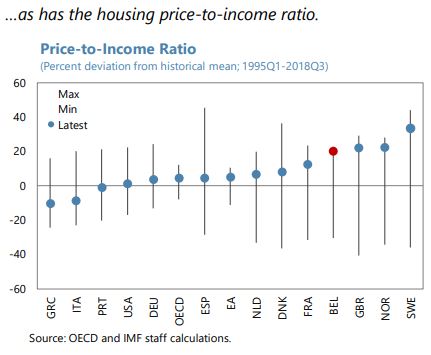
From the IMF’s latest report on Belgium:
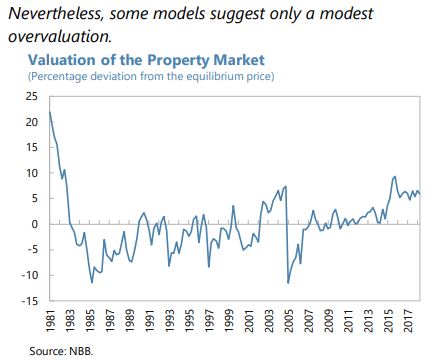
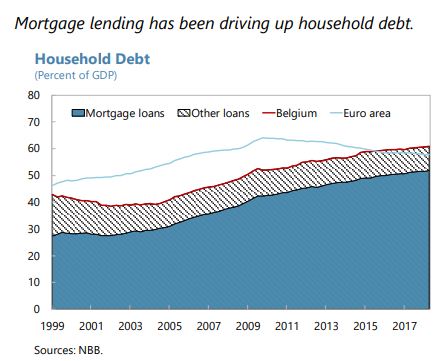
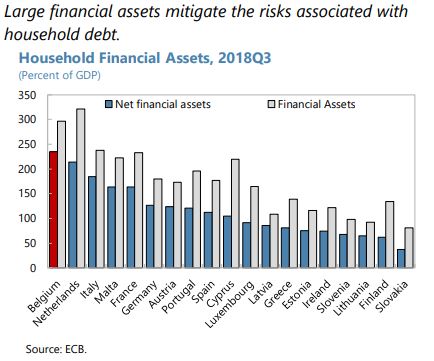
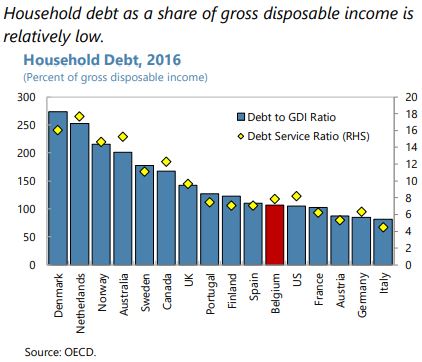
“Private sector indebtedness, primarily associated with household debt, and sustained increases in housing prices pose additional challenges. Strong growth in mortgage lending (9 percent in 2018) has contributed to a sizeable increase in household debt and housing prices. Models, however, point to only a modest house price overvaluation, depending on location. Meanwhile, the share of loans with a loan-to-value (LTV) ratio below 80 percent has declined by about 10 percentage points during 2014–2017. Although default rates are currently low, households have substantial assets in the aggregate, and household debt-to income is in line with peers, a sharp housing (and asset) price correction could result in rising defaults for some groups of the population and affect banks’ solvency, with second round effects on investment, consumption, and growth. 12 Belgian unconsolidated corporate debt has also increased over the last few years to a relatively high level, although, the level is more in line with peers after accounting for intragroup loans. Nonetheless, its dynamics warrant close monitoring, given recent strong bank credit growth to the corporate sector (…).
Staff welcomed the authorities’ recent macroprudential measures to address risks in the housing market and encouraged the authorities to remain proactive. To guard against a correction in housing prices and discourage banks from taking excessive credit risk, the National Bank of Belgium (NBB) introduced in May 2018 an add-on to risk weights on bank mortgage exposures as a new macroprudential measure. In view of the robust overall level of credit growth (5.9 percent in 2018) and credit gap (the NBB estimates this at 2 percent at end Q3-2018), staff recommended that the NBB continue to closely monitor the build-up of cyclical risks in both the household and corporate sectors and stand ready to tighten macroprudential policy further, including through the use of a countercyclical capital buffer. The authorities could also consider revising the framework for macroprudential decision-making to ensure the ability to deploy a broader range of macroprudential policies in a timely manner, as recommended by the 2017 Financial Sector Assessment Program (FSAP) mission.”
From the IMF’s latest report on Belgium:
“Private sector indebtedness, primarily associated with household debt, and sustained increases in housing prices pose additional challenges. Strong growth in mortgage lending (9 percent in 2018) has contributed to a sizeable increase in household debt and housing prices. Models, however, point to only a modest house price overvaluation, depending on location. Meanwhile, the share of loans with a loan-to-value (LTV) ratio below 80 percent has declined by about 10 percentage points during 2014–2017.
Posted by at 9:26 AM
Labels: Global Housing Watch
Subscribe to: Posts