


Wednesday, February 20, 2019
Wellbeing measurements, Easterlin’s paradox and new growth models: A perspective through gross national happiness
From VoxEU:
“There has been considerable criticism of the general reliance on GDP as an indicator of growth and development. One strand of criticism focuses on the inability of GDP to capture the subjective well-being or happiness of a populace. This column examines new growth models, paying particular attention to Bhutan, which has pursued gross national happiness, rather than GDP, since the 1970s. It finds evidence of the Easterlin paradox in Bhutan, and draws out lessons for macroeconomic growth models.
New Zealand’s Prime Minister, Jacinda Arden, recently proposed the idea of a ‘wellness budget’ for the country, and suggested that wellbeing should be incorporated into their growth agenda (Arden 2019). In a similar vein, William Nordhaus incorporated climate change into traditional growth models, efforts for which he was awarded the Nobel Memorial Prize in Economics (Gillingham 2018). In a famous article, Easterlin (1974, revised 1995) asked whether “raising the incomes of all will raise the happiness of all?”. This question was raised following the observation that reported happiness levels remained flat over the long-run in countries which had experienced high rates of real income growth. This anomaly was subsequently dubbed the Easterlin Paradox. How relevant is this in today’s times? The following table provides some interesting clues.
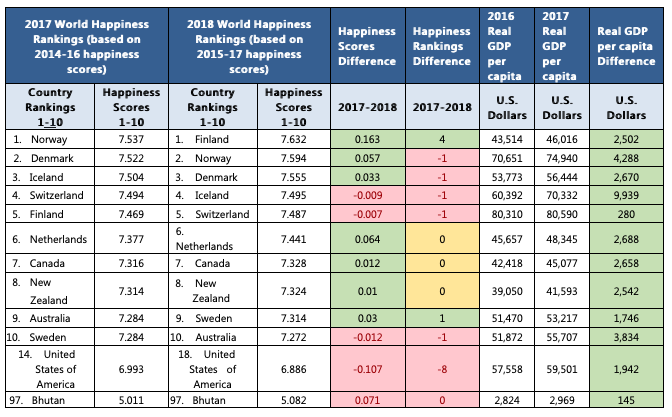
Table 1 World Happiness Rankings
Source: Helliwell et al. (2018)
In Table 1, the World Happiness Rankings for different years are compared with their respective real GDP per capita outcomes. According to the Easterlin Paradox (ceteris paribus), the change in World Happiness Scores should not be proportional to the change in real GDP per capita (year-on-year difference) in any given year. If this is the case, then the country with the highest per capita income will not necessarily be that with the highest levels of happiness.
As can be noted in the table, countries such as Iceland, Switzerland, and Australia seem to be in line with the Easterlin Paradox. Bhutan seems to follow a similar trend. Interestingly, the US seems to be following the Easterlin Paradox. This has been largely attributed to the reduction in America’s social capital and the fact that “…certain non-income determinants of US happiness are worsening alongside the rise in US per capita income, thereby offsetting the gains in subjective well-being that would normally arise with economic growth” (Helliwell 2018). As such, it is quite apparent that there is a discrepancy at some level between the perceived positive proportional relationship between the notion of incomes (input) and happiness (outcome). Not only does this introduce the need to look beyond income levels, it also reasserts the need to look at other well-being measurements, such as happiness, as key measures of growth outcomes.
How can this discrepancy be bridged? More importantly, how can these elements be incorporated in a systematic manner into the policymaking ecosystem, rather than merely being proclamations from higher moral ground?”
Continue reading here.
From VoxEU:
“There has been considerable criticism of the general reliance on GDP as an indicator of growth and development. One strand of criticism focuses on the inability of GDP to capture the subjective well-being or happiness of a populace. This column examines new growth models, paying particular attention to Bhutan, which has pursued gross national happiness, rather than GDP, since the 1970s. It finds evidence of the Easterlin paradox in Bhutan,
Posted by at 7:28 PM
Labels: Inclusive Growth
Tuesday, February 19, 2019
Housing Market in Slovenia
From the IMF’s latest report on Slovenia:
“Housing prices have completed their recovery from the deep slump during the double-dip crisis (2008–14) and continue to grow robustly, but current valuations do not point to overheating. The authorities have adopted macroprudential policy tools preemptively and continue to monitor developments. Easing supply constraints on the housing market could help to moderate future price increases.
Residential real estate prices rose at their fastest pace in 2017 since the outbreak of the crisis, recording the third highest rate in the euro area and a record number of transaction. Prices of used apartments in Ljubljana increased by 14.8 percent during 2017, compared to the national average increase of 11.8 percent. The overall housing price index rose 13.4 percent during the year to 2018: Q2.
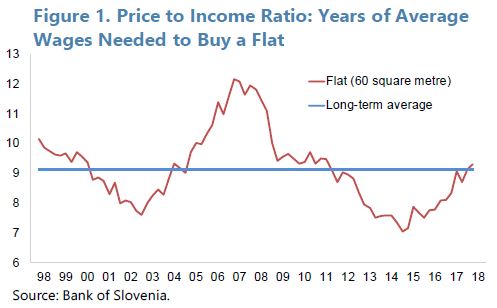
Housing remains affordable in historical and international comparison, and further appreciation in real house prices is likely. Wages and disposable incomes have increased since 2008, while real estate prices have only just reached their pre-crisis level. By some measures, the ratio of real estate prices to incomes stood at their long-term average in 2018 (Figure 1). At 54.4 percent, Slovenia has the second-lowest urbanization rate in the EU. Continued urbanization and growth in household incomes are expected to fuel continued appreciation of real estate prices.
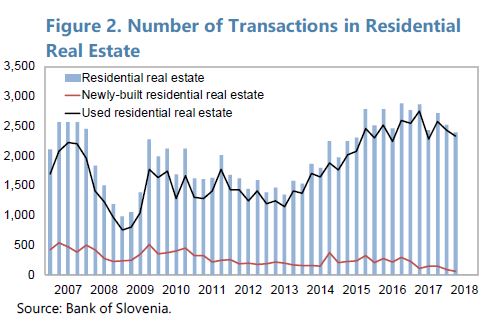
The supply of new residential housing has failed to keep pace with demand. The stock of housing in Slovenia is low by regional standards with 410 units per 1000 residents (compared to 547 in Austria and 524 in Croatia). The number of residential real estate transactions has been rising after 2013, yet the sales of newly-built units has dropped further from very low levels (Figure 2). The lack of supply response is related to the bankruptcy of major construction companies during the crisis years, the reluctance of banks to finance new construction, and constraints placed on new construction by urban planning and regulation.
Mortgage financing is not a significant driver of housing price developments. Slovenia has a comparatively high level of owner-occupied housing (77 percent of households, compared to 60 percent in the euro area, but comparable to other CEE countries). Only about 10 percent of households have a mortgage (19 percent in the euro area), and about a third of recent housing transactions was carried out with equity (i.e., without bank financing). The growth in mortgage lending has been positive since 2013, nearly reaching 5 percent year-on-year in 2017, but has since fallen back to below 4 percent.
The BoS has adopted macro-prudential policy tools as a preemptive step. Current data do not point to an overheating housing market or exposure by the banking sector. However, continued price increases and the inflexible supply response suggest the need for close monitoring. Guidance to banks on loan-to-value and DSTI ratios related to residential real estate transactions and a countercyclical capital buffer were implemented in 2016. In 2018, the applicability of the ratios was expanded to include not only mortgages but all household debt, prompted by rapidly growing consumer lending (albeit from a low level). Early adoption of the tools affords the banking sector time to adjust and monitor lending practices accordingly.
The government seeks to improve the supply of social housing. In 2015, Slovenia adopted its National Housing Program 2015–25 which calls for a new rental policy and an increase in social housing stock for the benefit of vulnerable groups, including young families and the elderly. The National Housing Fund, currently financing social housing investments by municipalities, could become a direct supplier, alleviating shortages of affordable housing.
Urban planning practices could be reformed to ease the supply of new housing. Zoning restrictions and the effort and time required to obtain all required permits before starting new construction projects impede the market response to rising house prices. Regulatory reform could therefore help to increase supply and slow the increases in real estate prices and rents.”
From the IMF’s latest report on Slovenia:
“Housing prices have completed their recovery from the deep slump during the double-dip crisis (2008–14) and continue to grow robustly, but current valuations do not point to overheating. The authorities have adopted macroprudential policy tools preemptively and continue to monitor developments. Easing supply constraints on the housing market could help to moderate future price increases.
Residential real estate prices rose at their fastest pace in 2017 since the outbreak of the crisis,
Posted by at 3:28 PM
Labels: Global Housing Watch
Housing Market in Nepal
From the IMF’s latest report on Nepal:
“Existing macroprudential measures, including the loan-to-value ratios on car loans and residential real estate, and limits on real estate sector exposure have helped to contain credit growth, but need to be tightened further. Staff welcomes the authorities’ stated intention to
adhere to the ceiling on the loan-to-deposit (LTD) ratio—so-called credit-to-core capital cum deposit (CCD) ratio.2 Several carve-outs have been introduced over time to provide more room for credit growth. These carve-outs, including the recent decision to allow funds obtained through interbank borrowing to count as deposits, should be phased out and the authorities should resist banks’ pressures for further effective relaxation of the CCD ratio and other macroprudential rules.”
From the IMF’s latest report on Nepal:
“Existing macroprudential measures, including the loan-to-value ratios on car loans and residential real estate, and limits on real estate sector exposure have helped to contain credit growth, but need to be tightened further. Staff welcomes the authorities’ stated intention to
adhere to the ceiling on the loan-to-deposit (LTD) ratio—so-called credit-to-core capital cum deposit (CCD) ratio.2 Several carve-outs have been introduced over time to provide more room for credit growth.
Posted by at 3:23 PM
Labels: Global Housing Watch
Labour mobility and adjustment to shocks in the euro area: The role of immigrants
From a new VOX post on the role of immigrants:
“The response of labour supply to negative shocks is different across regions due to varying levels of labour mobility. This column shows that the elasticity of labour supply in response to economic shocks is lower in the euro area than in the US, suggesting that a lack of labour mobility may be an obstacle to labour market adjustments in the euro area. Policies aimed at reducing the complexities of migrating for jobs could help ease this mobility gap.”
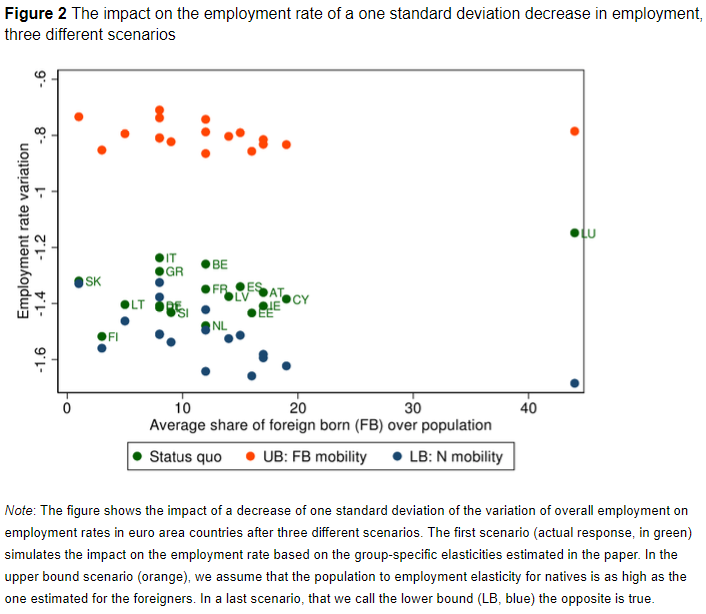
“The higher mobility of migrants implies that they can act as a buffer and reduce the fluctuations of the employment rate in response to regional shocks to employment. A simple counterfactual exercise can help appreciate the magnitude of such contribution. We first simulate the impact of a 1.9% decrease in the level of employment on the employment rate in each euro area country using the elasticities estimated for natives and foreign-born (the value is equal to one standard deviation of the series of overall employment variations). In this status quo scenario, the employment rate falls in all countries by 13% on average (the green dots in Figure 2). We then focus on two alternative scenarios, and simulate the same impact assuming that all individuals had the natives’ (low) elasticity or the foreigners’ (high) elasticity.
Comparing the first (lower bound) scenario to the status quo informs us on the current contribution of mobile foreign-born individuals in absorbing the shock – our estimates suggest that they help reduce its impact on employment rates at the country level by around 7% (to 1.4% on average, see the blue dots). And if all individuals had the same propensity to move as foreigners (as in the second, upper bound scenario), the impact of the negative employment shock would be halved (orange dots). These patterns are common to all euro area countries.”
From a new VOX post on the role of immigrants:
“The response of labour supply to negative shocks is different across regions due to varying levels of labour mobility. This column shows that the elasticity of labour supply in response to economic shocks is lower in the euro area than in the US, suggesting that a lack of labour mobility may be an obstacle to labour market adjustments in the euro area.
Posted by at 10:53 AM
Labels: Inclusive Growth
The forecasting record
From a new post:
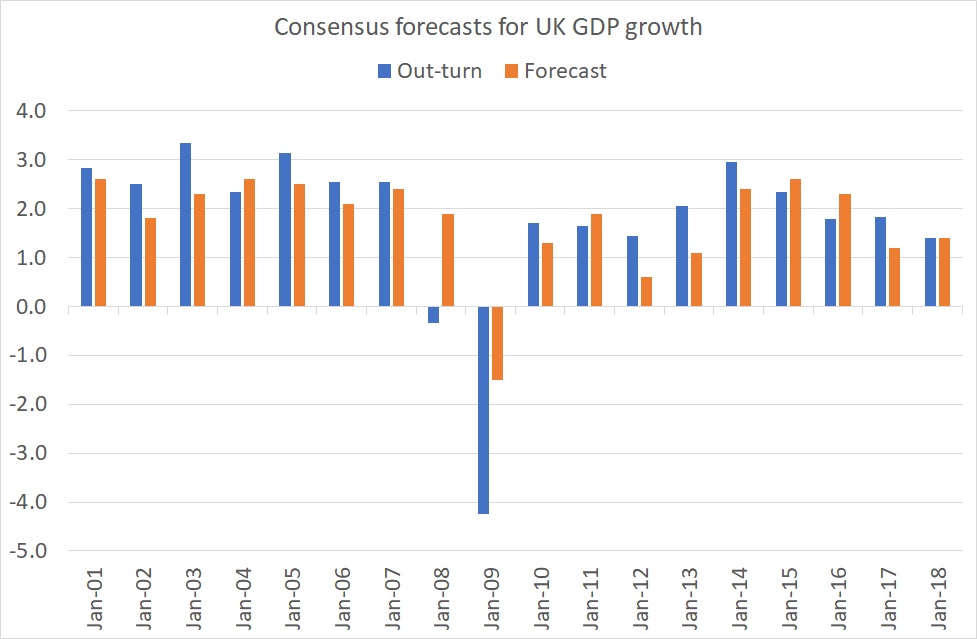
“The ONS says GDP grew by 1.4% last year. 1.4% is a significant number: it is exactly what the private sector economists surveyed by the Treasury predicted in December 2017 that growth would be in 2018.
Granted, this bulls-eye might not survive future revisions to GDP estimates. But it reminds us that economists’ forecasts for growth are often not too bad.
My chart shows the point. It compares forecasts made in December for growth the following year to actual growth since 2001. Most of the time, the forecasts aren’t too far out. Where they go badly wrong is in recessions. Economists don’t see these coming. In December 2007 they forecast that GDP would grow 1.9 per cent in 2008. In fact it shrank. And even in December 2008 – after the banking crisis – they grossly under-predicted the depth of the recession.
This fitted the pattern. Back in 2000 Prakash Loungani wrote:
The record of failure to predict recessions is virtually unblemished. Only two of the 60 recessions that occurred around the world during the 1990s were predicted a year in advance. That may seem like a tough standard to impose on forecast accuracy. Maybe so—but two-thirds of those recessions remained un-detected seven months before they occurred.
In December 1990, for example, UK economists forecast growth of 0.3% in 1991. In fact, we got a 1% drop.
Economic forecasts, then, are reasonably OK except when we really need them.
Why? One possibility, suggested by Loungani, is that economists are slow to update their forecasts in light of news. One bit of evidence for this is that they also under-predicted the boom of 1988 (probably because they over-estimated the adverse effect of the 1987 stock market crash). Another possibility is that mainstream forecasters lack incentives to break with the consensus and predict recessions: it’s better to be wrong in a crowd. It’s for this reason that it is mavericks and those wanting to make a name for themselves who predict doom.
I suspect, though, that there’s something else. It’s that recessions are caused by things which are hard for macroeconomists to discern. For example, Xavier Gabaix shows how they can be caused by failures at large firms. And Daron Acemoglu and colleagues have described how they can be amplified by network effects: trouble at a firm at the centre of a hub can spill over into other firms whereas trouble at a spoke does not. These are both part of the story of the 2008-09 crisis.
Macroeconomists are tolerably good at predicting fluctuations in aggregate demand. It is other things – such as supply shocks, network and peer effects or banking crises – they’re not so good at foreseeing.
It doesn’t automatically follow, however, that recessions are wholly unpredictable. US evidence strongly suggests that inverted yield curves lead (with a variable lag) to economic downturns. I suspect this is for the same reason that consumption-wealth ratios help predict bad times. It’s because such data aggregates the dispersed and fragmentary knowledge of countless individuals. There some specific conditions when the wisdom of crowds works better than experts.”
From a new post:
“The ONS says GDP grew by 1.4% last year. 1.4% is a significant number: it is exactly what the private sector economists surveyed by the Treasury predicted in December 2017 that growth would be in 2018.
Granted, this bulls-eye might not survive future revisions to GDP estimates. But it reminds us that economists’ forecasts for growth are often not too bad.
My chart shows the point.
Posted by at 10:51 AM
Labels: Forecasting Forum
Subscribe to: Posts