


Wednesday, December 12, 2018
China’s High Savings: Drivers, Prospects, and Policies
From a new IMF working paper by Longmei Zhang, Ray Brooks, Ding Ding, Haiyan Ding, Jing Lu, and Rui Mano:
“China’s high national savings rate—one of the highest in the world—is at the heart of its external/internal imbalances. High savings finance elevated investment when held domestically, or lead to large external imbalances when they flow abroad. Today, high savings mostly emanate from the household sector, resulting from demographic changes induced by the one-child policy and the transformation of the social safety net and job security that occured during the transition from planned to market economy. Housing reform and rising income inequality also contribute to higher savings. Moving forward, demographic changes will put downward pressure on savings. Policy efforts in strengthening the social safety net and reducing income inequality are also needed to reduce savings further and boost consumption.”
From a new IMF working paper by Longmei Zhang, Ray Brooks, Ding Ding, Haiyan Ding, Jing Lu, and Rui Mano:
“China’s high national savings rate—one of the highest in the world—is at the heart of its external/internal imbalances. High savings finance elevated investment when held domestically, or lead to large external imbalances when they flow abroad. Today, high savings mostly emanate from the household sector, resulting from demographic changes induced by the one-child policy and the transformation of the social safety net and job security that occured during the transition from planned to market economy.
Posted by at 7:15 AM
Labels: Macro Demystified
First-in, first-out: Driving the UK’s per capita carbon dioxide emissions below 1860 levels
From VoxEU:
“The Industrial Revolution has been of vast benefit to humanity, but it came at the cost of a global explosion in anthropogenic emissions of greenhouse gases. The UK was the first country into the Industrial Revolution. Now it is one of the first countries heading out, with annual CO2 emissions per capita back below the levels of the 1860s. This column presents an econometric model of UK emissions over the last 150 years to establish what has driven them down and reveal the impacts of important policies, especially the Climate Change Act of 2008. Even so, large reductions in all the UK’s CO2 sources are still required to meet its 2050 target of an 80% reduction from 1970 levels.
The Industrial Revolution began in the UK in the mid-18th century for reasons well explained by Allen (2009). With antecedents in the scientific, technological, and medical knowledge revolutions from two centuries earlier across many countries, the UK was the first country to industrialise on a large scale. The consequences are startling: 250 years later, real income levels per capita are about seven-fold higher (https://ourworldindata.org/economic-growth shows even greater changes in other countries), many killer diseases have been tamed, and longevity has approximately doubled. As Crafts (2002) showed, the average individual would be unwise to swap their life now for that of even one of the richest people several centuries ago; the Industrial Revolution and its successors have been of vast benefit to humanity.
An unintended consequence has been an explosion in atmospheric carbon dioxide and other greenhouse gas emissions. These are by-products of energy production, manufacturing, and transport (all about a quarter of emissions), with agriculture, construction and waste removal creating most of the rest. Although the UK’s first electricity generating power station in 1868 was hydro driven, coal-fired steam-driven power stations were introduced by 1882 and have since produced most of its electricity. The paleo-record over the last 750,000 years of intermittent ice ages shows atmospheric CO2 levels of between 180 parts per million (ppm) and 300ppm, but these levels now exceed 400ppm. The increases in atmospheric CO2 recorded since 1958 at Mauna Loa (Sundquist and Keeling 2009) are clearly anthropogenic in origin (e.g. Hendry and Pretis 2013). The climate change induced by increased greenhouse gases has potentially dangerous implications, highlighted by Stern (2006) and recent IPCC reports, leading to the agreement in Paris at COP21 to seek to limit temperature increases to less than 2 Centigrade, and “to pursue efforts to limit it to 1.5C’’. Much remains to reduce CO2 emissions towards the net zero level that will be required to stabilize temperatures at any level. Meinshausen et al. (2009) analyse the difficulties of even achieving 2C, but renewable technologies offer hope of at least further large emission reductions.
However, there was a dramatic drop in the UK’s per capita emissions of CO2 by 2017 to below the levels of the 1860s – the country first into the Industrial Revolution is one of the first out. On 22 April 2017, Britain went a full day without turning on its coal-fired power stations for the first time in more than 130 years, and on 26 May 2017 it generated almost 25% of its electrical energy from solar. The UK’s CO2 emissions are now just half of their peak level in 1970. How was this reduction achieved?
UK CO2 emissions
The data from 1860 on UK CO2 emissions, fossil fuel volumes, and the ratio of CO2 emissions to the capital stock are shown in Figure 1. While other greenhouse gas emissions matter, CO2comprises about 80% of the UK total, with methane, nitrous oxide, and hydrofluorocarbons (HFCs) making up most of the rest in CO2 equivalents. However, various fossil fuels have different CO2 emissions per unit of energy produced and depend on how efficiently fuels are burnt, from an open fire through vehicles, to a gas-fired power station.”
Continue reading here.
From VoxEU:
“The Industrial Revolution has been of vast benefit to humanity, but it came at the cost of a global explosion in anthropogenic emissions of greenhouse gases. The UK was the first country into the Industrial Revolution. Now it is one of the first countries heading out, with annual CO2 emissions per capita back below the levels of the 1860s. This column presents an econometric model of UK emissions over the last 150 years to establish what has driven them down and reveal the impacts of important policies,
Posted by at 5:03 AM
Labels: Energy & Climate Change
Tuesday, December 11, 2018
Beyond Okun’s Law: Output Growth and Labor Market Flows
From a new Tinbergen Institute Discussion Paper:
“Recently, in an important paper, Ball et al. (2017) investigated the Okun relationship for the US and 20 other advanced economies. Focusing on the fit of the relationship between the unemployment rate and output (using both the gap and difference form of Okun’s Law) they find for US data over the sample period 1948-2013 that Okun’s law is a strong, reliable and stable relationship and that a constant (not time-varying) Okun coefficient is a good approximation to reality. They also noted that the Okun coefficient appears to be larger during recessions than during expansions. How can we reconcile empirical evidence that Okun’s coefficient is stable over time, while being asymmetric over the business cycle?
Our paper proposes another look at the relationship between changes in the unemployment rate and output growth through the lens of labor market flows. As far as we know, no one has utilized flows data in this context. Yet clearly the change in the unemployment rate reflects the balance of flows into and out of unemployment within a period and thus it is natural to look at the Okun relationship as a relationship between output growth and labor market flows.”
From a new Tinbergen Institute Discussion Paper:
“Recently, in an important paper, Ball et al. (2017) investigated the Okun relationship for the US and 20 other advanced economies. Focusing on the fit of the relationship between the unemployment rate and output (using both the gap and difference form of Okun’s Law) they find for US data over the sample period 1948-2013 that Okun’s law is a strong, reliable and stable relationship and that a constant (not time-varying) Okun coefficient is a good approximation to reality.
Posted by at 8:46 PM
Labels: Inclusive Growth
100 Million and Counting: A Portrait of Economic Insecurity in the United States
From a new PolicyLink report:
“Economic insecurity is both widespread and uneven, reflecting not only the toxic polarization of wealth and income in this nation, but also the persistence of racial inequities. Structural racism and systemic barriers have long excluded people of color from American prosperity, and while economic insecurity plagues people of all races and ethnicities, people of color are disproportionately burdened by economic insecurity. Given the rapid demographic changes in the United States, if economic conditions do not improve among people of color, a larger and larger share of the population will struggle to make ends meet.
A mounting body of research suggests that such inequality and exclusion lead to declining economic growth. The inverse is also true: by developing high-impact, targeted solutions that dismantle barriers and connect economically insecure people and households to resources and opportunities, we can lay the foundation for an economy that works for everyone. Now is the time for bold policy and systems changes that deliver on the promise of inclusive prosperity.”
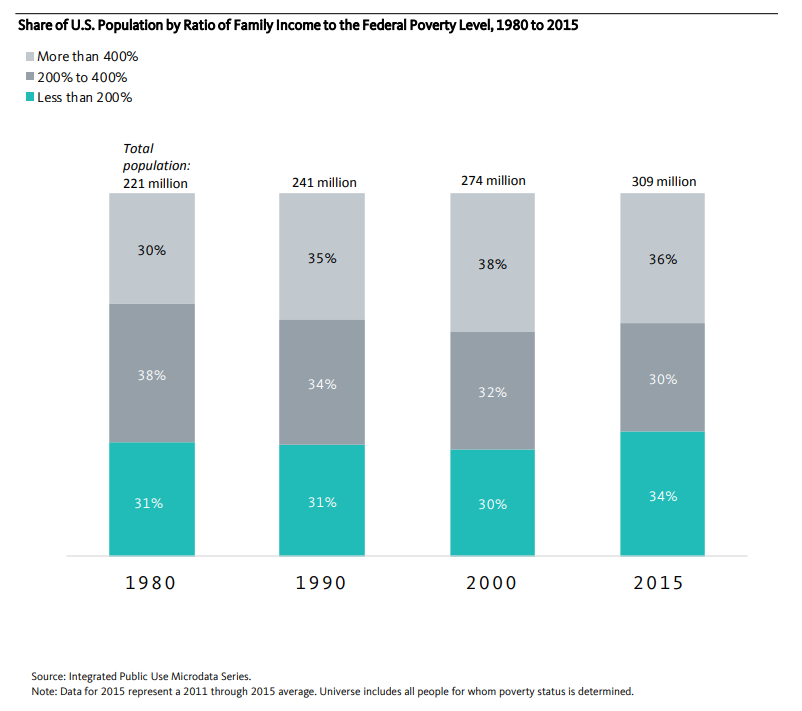
From a new PolicyLink report:
“Economic insecurity is both widespread and uneven, reflecting not only the toxic polarization of wealth and income in this nation, but also the persistence of racial inequities. Structural racism and systemic barriers have long excluded people of color from American prosperity, and while economic insecurity plagues people of all races and ethnicities, people of color are disproportionately burdened by economic insecurity. Given the rapid demographic changes in the United States,
Posted by at 8:43 PM
Labels: Inclusive Growth
Universal Basic Income: Debate and Impact Assessment
A new IMF working paper discusses “the definition and modelling of a universal basic income (UBI). After clarifying the debate about what a UBI is and presenting the arguments in favor and against, an analytical approach for its assessment is proposed. The adoption of a UBI as a policy tool is discussed with regard to the policy objectives (shaped by social preferences) it is designed to achieve. Key design dimensions to be considered include: coverage, generosity of the program, overall progressivity of the policy, and its financing.”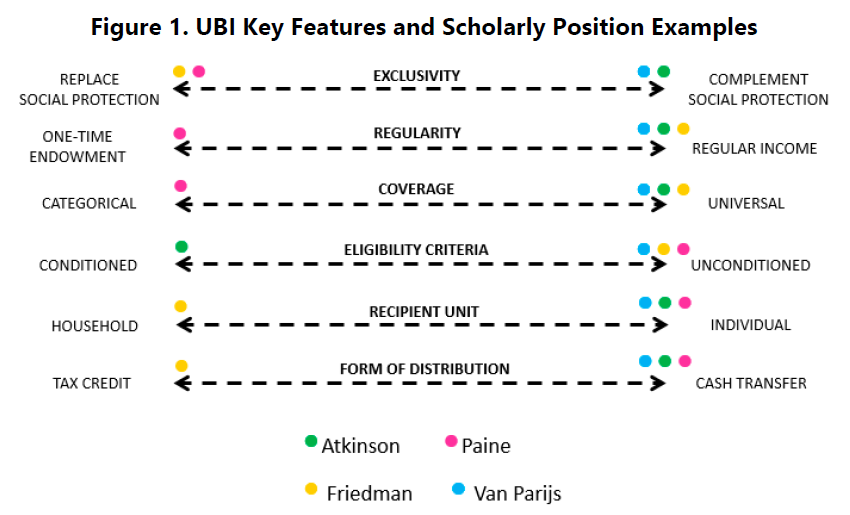
“The joint empirical analysis of the relative redistributive performance of a UBI, existing social
safety nets and available financing options is powerful in highlighting the tradeoffs faced by
policymakers when assessing social spending programs along key dimensions:
- coverage at the bottom of the income distribution vs. leakages to richer households,
- generosity of transfers vs. incentives and economic distortions,
- fiscal cost vs. alternative use of scarce fiscal resources.
The fourth aspect that weighs heavily in shaping policy choices is how to reconcile objectives and
implementation challenges.
The saliency of each of these tradeoffs depends on each country specific circumstances, in
particular on its position in the coverage/generosity/progressivity space (Figure 2), its capacity to
raise resources in a progressive and sustainable manner and the ability to roll out a (more or less)
complex program. Social preferences, together with constraints, determine how these tradeoffs
are called.
The relevance of these tradeoffs and the design of a transfer program has implications that go beyond the performance of the specific scheme. They are related to and impact how a country overall benefit-tax system affects individual behaviors,27 bearing far-reaching implications for labor market, consumption and investment decisions that will in turn impact back the fiscal sustainability of the tax-and-transfer system. As mentioned, inefficiencies (e.g., disincentives to
work) are relevant issues also under existing safety nets—that are rarely universal and unconditional—and their current financing mechanism. For this reason, a broader discussion is needed, that would move beyond just looking at UBI in isolation to assessing whether a policy package encompassing a UBI would increase or decrease the distortionary impact of government policies and or improve/reduce the performance of a safety net. As important is the thorough assessment of implementation capacity both for targeted and universal type of programs. In short, efficiency and equity impact of a UBI cannot be gauged in isolation.
Beyond the discussion presented in this paper and short-term considerations, other issues also point to the usefulness of broadening the horizon when discussing universal programs and looking for ways to make social protection systems adequate for facing future challenges. For example, in an economic environment where job security decreases and income volatility increases, expanding available insurance mechanisms for those who are out of work may become an important policy objective; similarly, where there is a need to generate public support while protecting vulnerable households from undesired side effects of structural reforms that impact large segments of the population. protecting vulnerable households from undesired side effects of structural reforms that impact large segments of the population.”
A new IMF working paper discusses “the definition and modelling of a universal basic income (UBI). After clarifying the debate about what a UBI is and presenting the arguments in favor and against, an analytical approach for its assessment is proposed. The adoption of a UBI as a policy tool is discussed with regard to the policy objectives (shaped by social preferences) it is designed to achieve. Key design dimensions to be considered include: coverage,
Posted by at 8:38 PM
Labels: Inclusive Growth
Subscribe to: Posts