


Thursday, October 27, 2016
A “New Normal” for the Oil Market
From iMFdirect:
While oil prices have stabilized somewhat in recent months, there are good reasons to believe they won’t return to the high levels that preceded their historic collapse two years ago. For one thing, shale oil production has permanently added to supply at lower prices. For another, demand will be curtailed by slower growth in emerging markets and global efforts to cut down on carbon emissions. It all adds up to a “new normal” for oil.
The “new” oil supply
Shale has been a game changer. Unexpectedly strong shale-oil production of 5 million barrels per day contributed to the global supply glut. That, along with the surprising decision by the Organization of the Petroleum Exporting Countries (OPEC) to keep production unchanged, contributed to the oil price collapse that started in June 2014.
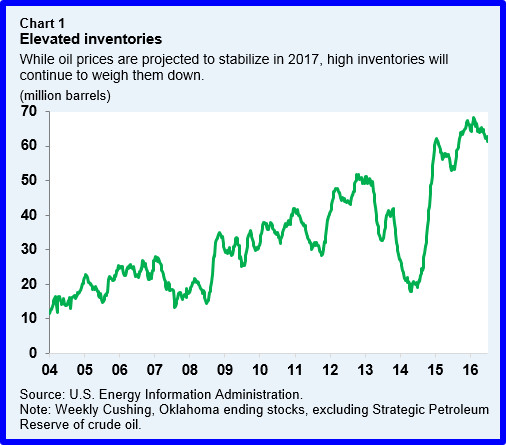
Although the price collapse led to a massive cut in oil investment, production was slow to respond, keeping supply in excess. What’s more, the resilience of shale production to lower prices again surprised market participants, leading to even lower prices in 2015. Shale drillers significantly cut costs by improving efficiency, allowing major players to avoid bankruptcy. While reduced investment is expected to result in lower production by non-OPEC countries in 2016, production still exceeds consumption. Many experts expect oil markets to balance in 2017, albeit with high level of inventory (Chart 1). That said, there is uncertainty regarding supply, especially regarding the cost associated with extraction as well as production from so-called shale “fracklog”—drilled but uncompleted wells. The latter can add to production flows in a matter of weeks and hence considerably change the dynamics of production compared to conventional oil—that features long lead times between investment and production.
Against that backdrop, OPEC countries and Russia have been increasing output, and Iran’s return to markets has added even more supply. (While OPEC members have recently agreed to cut production, that agreement is yet to be finalized.) There are other factors at play. Recent data suggest that shale-oil production may be once again more resilient than expected. And the anticipation of an OPEC production cut in cooperation with other exporters has boosted prices to the level that will further stimulate output by many shale producers.
Continue reading here.
From iMFdirect:
While oil prices have stabilized somewhat in recent months, there are good reasons to believe they won’t return to the high levels that preceded their historic collapse two years ago. For one thing, shale oil production has permanently added to supply at lower prices. For another, demand will be curtailed by slower growth in emerging markets and global efforts to cut down on carbon emissions. It all adds up to a “new normal” for oil.
Posted by at 11:47 AM
Labels: Energy & Climate Change
Wednesday, October 26, 2016
Housing in the U.S.: Affordable or Not?
From the Global Housing Watch Newsletter: October 2016
How do we measure housing affordability? What does the data tell us about the United States? What explains the different patterns? What is the short term outlook? What can policymakers do? These are some of the questions that Svenja Gudell tackles in the November issue of the Global Housing Watch Newsletter. Gudell is the Chief Economist of Zillow and a leading expert on the U.S. housing market.
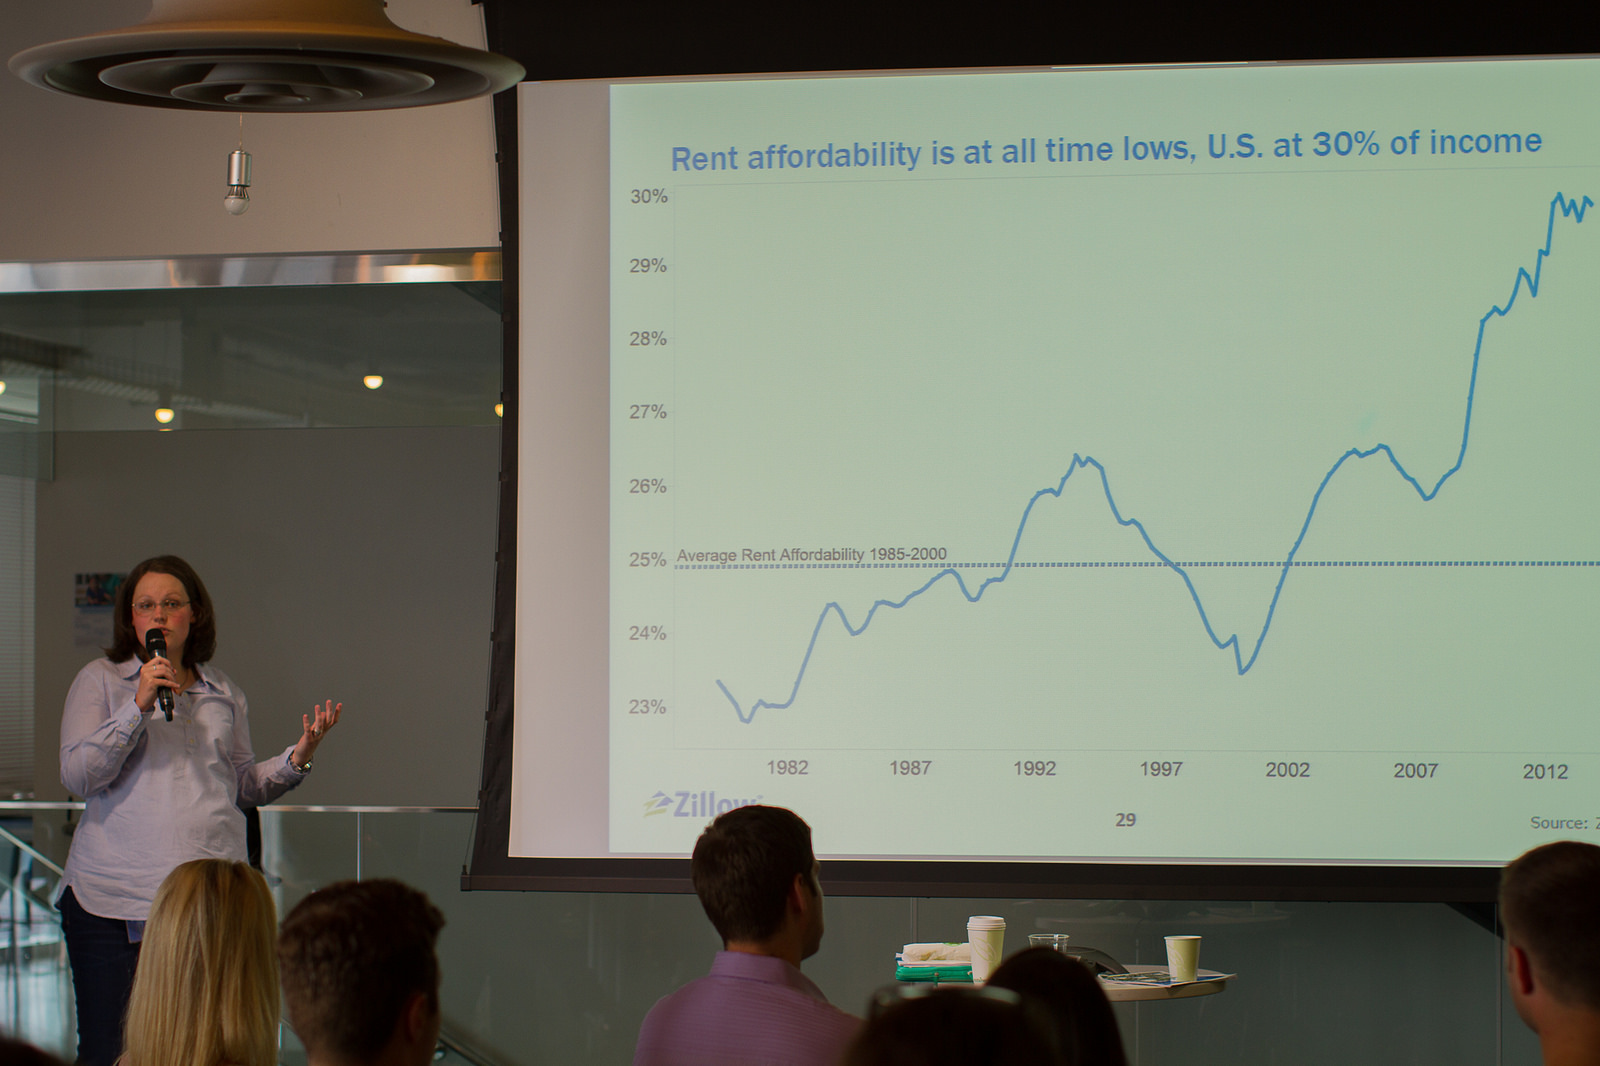
Svenja Gudell presenting housing market data (Photo credit: Adam Cohn)
Hites Ahir: Zillow has a lot of great data on the U.S. housing market and it is available to the public. So how do you track housing affordability?
Svenja Gudell: Zillow’s research frames housing affordability as the percent of someone’s monthly income spent on a mortgage or rental payment. For renters and buyers alike, we assume they make their area’s median annual household income and will be making the area’s median rent or mortgage payment. For home buyers, we make a few basic additional assumptions: that they are making a 20 percent down payment on the median-valued home in their area, and that they are financing their purchase with a conventional, 30-year, fixed-rate mortgage at prevailing mortgage rates as published by Freddie Mac. We publish this data assuming a resident is earning their area’s annual median household income and paying for median housing costs. In addition to considering the median, we also dig a little deeper to look at the tails of the distribution. So for a resident making their area’s median bottom-third household income (the median of the bottom third of the income distribution in that area), we match that buyer with either the mortgage payment of the median bottom-tier home – often a less expensive or entry level home – or the bottom-tier median rental payment. We do the same for the top third of the market, where residents making their area’s median top-third household income, are matched with the median top-third home or rental payment. We calculate all these affordability stats at the metro and city level.
We approach affordability in this way because we feel it provides an intuitive sense for consumers of the actual costs of housing to their household budget each month. It’s easy to communicate, for example, that renting the median home in the Seattle metro will consume 32 percent of a resident’s typical salary each month. More traditional measures of affordability, like price-to-income ratios or price-to-rent ratios, typically only produce a non-specific number that doesn’t tell the consumer very much. For example, the current price-to-income ratio in the Seattle metro is 5.2. In addition, this also doesn’t include the impact a low mortgage rate has on spending power.
Hites Ahir: What do the data show for the national and local level?
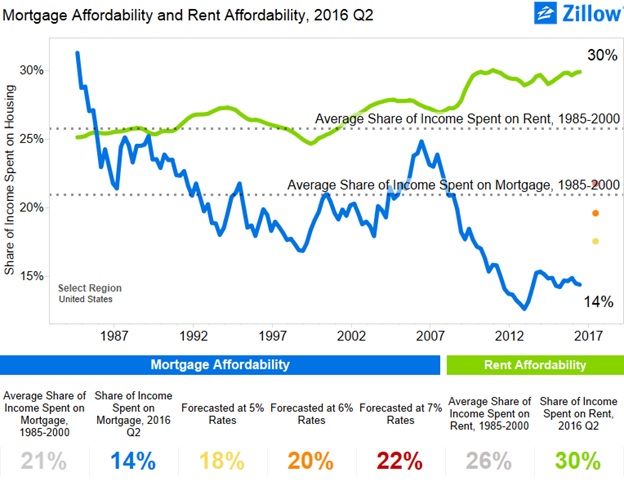
Svenja Gudell: In a general sense, buying a home currently is much more affordable than renting a home. Nationwide, buying the typical U.S. home on the median U.S. household income will consume about 14 percent of your monthly pay. Renting the typical home will consume 30 percent of income. Compared to historic norms, buying a home today is much more affordable than it was in prior decades: from 1985 through 2000, buying a home consumed, on average, about 21 percent of a buyer’s income. For renters, the story is reversed – renting today is much less affordable than it was in the pre-bubble years, when the typical rental consumed about 26 percent of income.
The reason buying a home is so much more affordable today comes down to today’s historically low mortgage interest rates, which help keep monthly mortgage costs low even as home values rise. Today, prevailing mortgage rates are hovering near or below 4 percent, far less than the 8 percent or higher rates that prevailed throughout much of the 1980s and 1990s. Mortgage interest rates will need to rise to roughly 7 percent before buying a home becomes less affordable than it was in the pre-bubble years (given forecasted home values over the next year), giving the overall U.S. housing market lots of headroom before mortgage affordability becomes a widespread concern. Renters, of course, can’t take advantage of low interest rates to help finance their rent, and so as rents have risen, the share of income needed to afford them has also gone up. Rental affordability problems are already emerging in many markets, and look set to only get worse as rents keep rising.
But while affordability looks pretty good at a national level (at least for home buyers) in a handful of very popular, pricey markets, the share of income necessary to afford a typical mortgage is already exceeding historic norms – even with historically low mortgage rates. In the Los Angeles metro, for example, buyers should currently expect to spend 38 percent of their income on a mortgage, up from 35 percent historically. If and when mortgage interest rates rise to 5 percent – a decent jump, but not outside the realm of possibility in the mid-term – Angelenos looking to buy a home should expect to spend almost half (46 percent) of their income on a mortgage. Renters in the L.A. area are already spending almost half their incomes on a typical rental payment (48 percent), and this share will only rise as rents keep going up at a faster pace than incomes. We see similar stories in other hot California markets, including San Diego and the Bay Area. In the long-run, these kinds of trends aren’t sustainable, and either incomes will need to grow very substantially, or housing costs will eventually need to level off or even come down a bit, in order to keep these communities affordable to typical residents.
Hites Ahir: If we look at housing affordability by income groups, what do the data show?
Svenja Gudell: It’s a lot easier for home buyers and renters at the top of the income distribution than it is for those at the bottom. Currently, those making the median, bottom-third U.S. household income and looking to buy the median, bottom-third/entry-level U.S. home should expect to pay roughly twice the share of their income toward a mortgage as those making the typical top-third income and buying a top-third home. In very expensive areas, like the San Francisco Bay Area, lower-income buyers should expect to pay almost 70 percent of their income toward a mortgage on an entry-level home. Essentially, in an area like San Francisco, it’s virtually impossible to afford housing costs on a low income and also afford all the rest of life’s necessities.
For lower-income renters, the situation is even more dire. Again in the Bay Area, a lower-income renter looking to rent even a less-expensive, bottom-third rental home will need to pay more than 86 percent of their income on rent – more than three times as much as a higher-income peer renting a more expensive, top-third home. Realistically, lower-income renters need to find multiple roommates to help shoulder this kind of burden; or try to work longer hours or find a second (or third) job to make ends meet.
Hites Ahir: What explains these patterns?
Svenja Gudell: Housing affordability is essentially defined by two basic factors: income and housing costs. If income rises at roughly the same pace as housing costs, then affordability doesn’t change much. If income growth exceeds growth in housing costs, then affordability can be expected to improve, in a general sense. If incomes stay flat or fall, but housing costs rise, then housing affordability will suffer. (Assuming relatively stable mortgage rates on the mortgage affordability side. As mortgage rates rise, affordability will also worsen, all else equal, as housing costs will rise.)
Over the past decade-plus, incomes at the upper end of the distribution have risen strongly, but incomes for the lowest earners have barely budged. At the same time, housing costs have risen fairly steadily over the past few years – especially rents, which largely did not see the big drop during the recession that home values did, and instead kept chugging upward. Exacerbating the problem at the lower-end of the market is the fact that bottom-tier home values are increasing at roughly double the pace of top-tier home values. This is largely attributable to low supply of homes for sale overall, especially at the bottom end of the market, and very high demand for those homes that are available. Investors, cash buyers and “regular” buyers alike are all competing for these homes, pushing prices up – which in turn contributes to mounting affordability issues.
Hites Ahir: In a recent article, you looked into the link between the housing bust and inequality. What did you find?
Svenja Gudell: The housing bust disproportionately impacted homeowners in lower-tier, less expensive homes – the share of entry-level homes foreclosed upon since 2006 is roughly three times the share of higher-end homes foreclosed upon over the same time. Most of these homes were foreclosed upon simply because their owners had less means to absorb some of the financial shocks of the recession, like a lost job. And those that were able to hang onto their homes often slid into negative equity, in which their home was worth less than the outstanding mortgage balance on it, making it virtually impossible to sell without a complicated, lengthy and costly short sale or mortgage modification. Once in negative equity – sometimes very deep – many of these homeowners simply gave up and let their home fall into foreclosure rather than keeping up with a mortgage and throwing good money after bad, exacerbating the foreclosure problem.
But in the years following the recession, the value of foreclosed homes climbed dramatically. Investors and cash buyers scooped them up to turn them into rentals, along with natural demand from first-time buyers and recent renters. Throughout the entire recovery, foreclosed homes showed greater annual appreciation than homes in general, peaking at 12.4 percent in January 2014, and falling to 6.8 percent by April 2016. Overall median U.S. home values, over the same time, reached a high of 7.9 percent annual growth in April 2014, with growth slowing to a pace of 4.9 percent by April 2016. Homeowners that were foreclosed upon, then, missed out on this opportunity to see large gains in their personal wealth as their home values grew. Their wealthier peers, able to purchase these homes at the bottom of the market and convert them into rentals, or homeowners that were able to hang on to their homes during the recession, only saw their wealth grow.
There is no small amount of irony in the fact that, after foreclosure, many former homeowners were prohibited from buying again with a mortgage for seven years, and so millions were forced to rent the exact same kind of homes they had owned only a few years prior. What’s more, these homeowners exchanged the relative stability and predictability of a monthly mortgage payment for the instability of rent.
And there’s still more salt to throw on the wound with the benefit of hindsight. It’s likely that millions of hardworking Americans found ways to hold on to their homes through the first few years of the recession, only to be foreclosed upon later – which actually turned out worse for them than simply giving the home up in the early years. A homeowner who foreclosed on a home in 2007 would have theoretically been able to buy again in 2014, and may have realized some of the gains in housing of the past few years. But a homeowner that held out desperately only to finally succumb to foreclosure in 2010 or 2011, won’t be able to buy again until 2017 or 2018.
Hites Ahir: In the short run, will housing affordability deteriorate or improve?
Svenja Gudell: We got some encouraging news recently that incomes last year rose at roughly the same pace as housing costs, a strong year of growth after years of stagnant or even falling wages. At a minimum, this kind of growth should at least mean that housing affordability maintains its current status quo, and doesn’t get worse. It’s good news, but one strong year of income growth isn’t enough to make up for several more years of low/no growth, coupled with very steady growth in housing costs. For housing affordability to meaningfully improve for most Americans – particularly renters – incomes will need to show solid growth for several more years to come. In addition, slowing home value appreciation and rental appreciation will help give incomes a chance to catch up.
Hites Ahir: What can policymakers do to address housing affordability issues? Are there any success stories that we can learn from?
Svenja Gudell: Solving housing affordability issues from a federal level is tricky, since so much of what determines housing affordability and the ability to build/maintain affordable housing is determined at a local level. In a general sense, policies which continue to promote job and wage growth will – obviously – help. Cutting down some of the local and regional barriers to creating affordable housing, like zoning constraints, permitting timelines and effective transit from areas with affordable housing to areas with abundant jobs will also help. Places where its relatively easy to build new housing – like Houston, for example – have succeeded in keeping housing affordable in a general sense, and there are lessons to be learned from their successes. Of course, not every market has as much physical room to grow as Houston or other wide-open areas in the middle of the country, so there is no “one size fits all” approach.
From the Global Housing Watch Newsletter: October 2016
How do we measure housing affordability? What does the data tell us about the United States? What explains the different patterns? What is the short term outlook? What can policymakers do? These are some of the questions that Svenja Gudell tackles in the November issue of the Global Housing Watch Newsletter. Gudell is the Chief Economist of Zillow and a leading expert on the U.S.
Posted by at 5:30 PM
Labels: Global Housing Watch
Sunday, October 23, 2016
Employment, Efficiency, Equity: Evolution in IMF Thought

Fear of “others” taking “our” jobs is a staple of economic discourse. Sometimes it is a fear of China, sometimes of robots; today it is a fear of the effects of Chinese investment in robots. Digital technology and the ‘sharing’ economy have transformed the world of work, but they have also fueled familiar fears about the impact of technology on jobs.
Technological advancements boost productivity, the demand for labor and the quantity and quality of jobs. They contribute to national and global long-run efficiency and more arguably, to long-run equity at a global level.
But along with these benefits, policymakers must acknowledge and address the displacement that results from the use of new technology. Without appropriate policy frameworks to manage these changes, fears about the short-run job losses will trump the longer-run benefits of technology adoption.
In the last few years, the International Monetary Fund’s (IMF) policy advice is increasingly geared toward balancing the efficiency and equity effects of labor market developments. The evolution in its thinking and advice has three aspects, and is pertinent to how policymakers deal with labor market impacts of new technology.
First, more so now than in the past, the IMF is paying attention to the distributional consequences of economic developments and policies. Second, its framework for thinking about labor market policies is one that increasingly recognizes that many policies need to strike a balance between promoting efficiency and protecting the basic needs of workers. Third, the institution has tried to elevate the importance of job creation in policy discussions with a ‘two-handed’ approach – one that recognizes the importance of both aggregate demand and aggregate supply, and advocates policies to boost both.
This evolution bodes well for the IMF’s ability to offer good advice on employment, including how to manage the effects of technology on the quantity and quality of jobs.
Continue reading here.
Fear of “others” taking “our” jobs is a staple of economic discourse. Sometimes it is a fear of China, sometimes of robots; today it is a fear of the effects of Chinese investment in robots. Digital technology and the ‘sharing’ economy have transformed the world of work, but they have also fueled familiar fears about the impact of technology on jobs.
Technological advancements boost productivity, the demand for labor and the quantity and quality of jobs.
Posted by at 10:01 AM
Labels: Inclusive Growth
Technology, Efficiency and Equity
From Just Jobs Network:
Technology is fundamentally reshaping the nature of work worldwide, spurring heated debate. While some worry that deepening automation and the rapid growth of online and “on-demand” labor platforms are eroding job quantity and quality, others claim that productivity gains will translate into more and better jobs in the long run. With its 2016 signature volume, JustJobs Network introduces real case studies from around the world, examining how technology in its different dimensions is changing employment outcomes.

Key Themes
- The discourse on technology highlights the trade-off between efficiency and equity, and policy frameworks must strike a balance between the two.
- The on-demand economy demands new forms of regulation and worker representation. Policymakers must be proactive about harnessing its benefits and minimizing its costs.
- Technology holds the promise of improving livelihoods and enabling labor market access for marginalized communities, but these effects should not be overestimated.
- Workers are leveraging digital technologies to empower and organize themselves.
- New technologies require rethinking “work design” – the way labor and technology are deployed, how work is executed and the kinds of tasks and interactions it involves.
Click here to see the report.
From Just Jobs Network:
Technology is fundamentally reshaping the nature of work worldwide, spurring heated debate. While some worry that deepening automation and the rapid growth of online and “on-demand” labor platforms are eroding job quantity and quality, others claim that productivity gains will translate into more and better jobs in the long run. With its 2016 signature volume, JustJobs Network introduces real case studies from around the world, examining how technology in its different dimensions is changing employment outcomes.
Posted by at 9:54 AM
Labels: Inclusive Growth
Wednesday, October 19, 2016
Top 100 in global finance: two from the IMF make the cut

PATH TO POWER: Ostry earned his BA from Queen’s University in Canada when he was just 18 and went on to receive a BA and MA from Oxford, an MS from the London School of Economics and a PhD in economics from the University of Chicago. He joined the IMF in 1988 as an economist in the research and European departments, and has held a variety of roles in the years since, including heading up the group’s influential biannual World Economic Outlook survey. He became deputy director of research in 2006. Ostry writes prolifically for publications including The Economist, the Financial Times and the Wall Street Journal and has been cited in economic remarks by President Obama.
POWER PLAY: Ostry has been pursuing research seemingly at odds with IMF orthodoxy for years; in a 2014 Financial Times article, for example, he decried inequality and argued for “a more redistributive tax system.” But he made his biggest splash in June of this year when he coauthored a paper simply titled “Neoliberalism: Oversold?,” published in the IMF’s own Finance & Development magazine. In it, Ostry lays out a deeply researched argument against austerity and wholesale capital account liberalization, neoliberal policies that have been gospel at the IMF for decades. The month before the paper’s release, the IMF called for massive debt relief for Greece.

PATH TO POWER: The native Parisian specialized in antitrust law at Baker & McKenzie for 24 years before entering French politics in 2005. She began as a trade minister in Jacques Chirac’s cabinet, and was Nicolas Sarkozy’s agriculture and, later, finance minister. In 2011, she took over as managing director of the IMF from Dominique Strauss-Kahn, who stepped down after being charged with attempted rape.
POWER PLAY: Though Lagarde has been widely credited with restoring the IMF’s credibility following the scandalous exit of her predecessor and for being the voice of reason during the Greek debt crisis, she has been dogged by her role in the decade-old Bernard Tapie affair involving accusations of corruption in the sale of Adidas. Her decision as French finance minister in the 2008 case led to a 404-million-euro arbitration payout for Tapie, who had ties to Sarkozy. That payment was eventually annulled and Lagarde was absolved of wrongdoing, but a recent corruption probe into the incident has her facing negligence charges and up to one year in jail. Despite this distraction, the IMF appointed Lagarde to a second term in February, and she continues to receive its board’s support.
For the full list click here.
PATH TO POWER: Ostry earned his BA from Queen’s University in Canada when he was just 18 and went on to receive a BA and MA from Oxford, an MS from the London School of Economics and a PhD in economics from the University of Chicago. He joined the IMF in 1988 as an economist in the research and European departments, and has held a variety of roles in the years since,
Posted by at 6:44 AM
Labels: Profiles of Economists
Subscribe to: Posts