


Wednesday, January 5, 2022
The Price of Nails since 1695: A Window into Economic Change
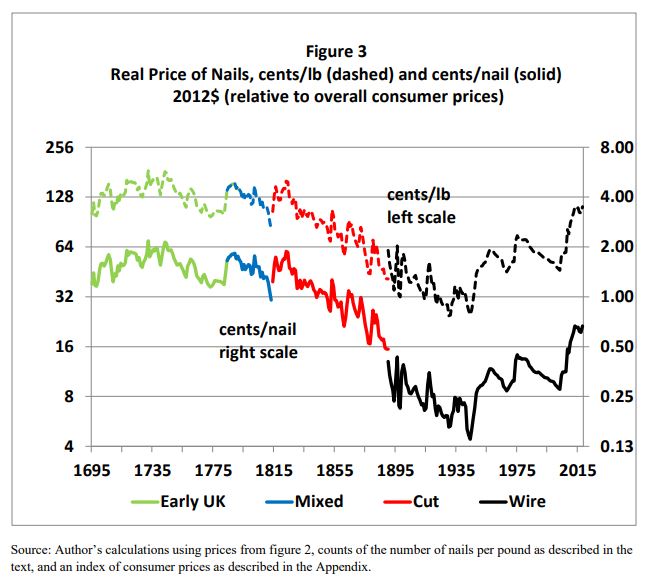
From a NBER paper by Daniel E. Sichel:
“This paper focuses on the price of nails since 1695 and the proximate source of changes in those prices. Why nails? They are a basic manufactured product whose form and quality have changed relatively little over the last three centuries, yet the process for producing them has changed dramatically. Accordingly, nails provide a useful prism through which to examine a wide range of economic and technological developments that touch on multiple areas of both micro- and macroeconomics. Several conclusions emerge. First, from the late 1700s to the mid 20th century real nail prices fell by a factor of about 10 relative to overall consumer prices. These declines had important effects on downstream industries, most notably construction. Second, while declining materials prices contribute to reductions in nail prices, the largest proximate source of the decline during this period was multifactor productivity growth in nail manufacturing, highlighting the role of the specialization of labor and re-organization of production processes. Third, the share of nails in GDP dropped back from 0.4 percent of GDP in 1810—comparable to today’s share of household purchases of personal computers—to a de minimis share more recently; accordingly, nails played a bigger role in American life in that earlier period. Finally, real nail prices have increased since the mid 20th century, reflecting in part an upturn in materials prices and a shift toward specialty nails in the wake of import competition, though the introduction of nail guns partly offset these increases for the price of installed nails.”
From a NBER paper by Daniel E. Sichel:
“This paper focuses on the price of nails since 1695 and the proximate source of changes in those prices. Why nails? They are a basic manufactured product whose form and quality have changed relatively little over the last three centuries, yet the process for producing them has changed dramatically. Accordingly, nails provide a useful prism through which to examine a wide range of economic and technological developments that touch on multiple areas of both micro- and macroeconomics.
Posted by at 8:56 AM
Labels: Macro Demystified
Tuesday, January 4, 2022
How long can the global housing boom last?
From The Economist:
“The IMF’s global house-price index, expressed in real terms, is well above the peak reached before the 2007-09 financial crisis. American housebuilders’ share prices are up by 44% over the past year, compared with 27% for the overall stockmarket. Estate agents from Halifax’s mom-and-pop shops to the supermodel lookalikes on Netflix’s “Selling Sunset”, in Los Angeles, have never had it so good.
Now people are wondering whether the party is about to end. Governments are winding down stimulus. People no longer have so much spare cash to splurge on property, now that foreign holidays are back and restaurants are open. Central banks, worried about surging inflation, are tightening monetary policy, including by raising interest rates. In its latest financial-stability report the IMF warned that “downside risks to house prices appear to be significant”, and that, if these were to materialise, prices in rich countries could fall by up to 14%. In New Zealand, where prices have risen by 24% in the past year, the central bank is blunter. The “level of house prices”, it says, is “unsustainable”.
But is it? (…)
Fundamental forces may once again explain why house prices today are so high—and why they may endure. Three reasons stand out: robust household balance-sheets; people’s greater willingness to spend more on their living arrangements; and the severity of supply constraints.”
From The Economist:
“The IMF’s global house-price index, expressed in real terms, is well above the peak reached before the 2007-09 financial crisis. American housebuilders’ share prices are up by 44% over the past year, compared with 27% for the overall stockmarket. Estate agents from Halifax’s mom-and-pop shops to the supermodel lookalikes on Netflix’s “Selling Sunset”, in Los Angeles, have never had it so good.
Now people are wondering whether the party is about to end.
Posted by at 8:11 PM
Labels: Global Housing Watch
Rising Inflation and the Cause for Concern
In a piece for the VoxEU CEPR blog, Professors Francesco D’ Acunto of Boston College and Michael Weber of Booth School of Business, University of Chicago write about rising inflation in the times of Covid-19 pandemic, and why it may be worrisome for reasons even beyond those that we think most about. Aside from the three channels that have been discussed often (pent-up demand pressures, supply constraints, and labor shortages), they bring into focus the self-fulfilling nature of consumers’ expectations of prices that impacts inflation rates.
The natural question then is why should policymakers be concerned about households’ expectations of price levels anyway.
“The concern is that a surge in inflation expectations might become self-fulfilling. Recent research uses microdata to document that higher inflation expectations often result in higher consumer spending before prices increase. Further demand pressure given the post-COVID supply bottlenecks would push inflation even higher.” They further go on to add, “households might also demand higher wages to keep their perceived purchasing power constant based on their elevated inflation expectations.”
Click here to read the full article.
In a piece for the VoxEU CEPR blog, Professors Francesco D’ Acunto of Boston College and Michael Weber of Booth School of Business, University of Chicago write about rising inflation in the times of Covid-19 pandemic, and why it may be worrisome for reasons even beyond those that we think most about. Aside from the three channels that have been discussed often (pent-up demand pressures, supply constraints, and labor shortages), they bring into focus the self-fulfilling nature of consumers’
Posted by at 9:52 AM
Labels: Macro Demystified
Monday, January 3, 2022
Correlates of declining income inequality in emerging and developing nations
In an upcoming publication for World Development titled, ‘The correlates of declining income inequality among emerging and developing economies during the 2000s’ (2022), author Edward Anderson of the University of East Anglia discusses patterns that were frequently observed in countries that experienced declining levels of income inequality.
Among the most significant results of the paper, one states that “the tendency toward declining inequality in the 2000s was stronger in countries with higher initial levels of inequality and larger increases in relative agricultural productivity, country-specific primary commodity prices, and remittance inflows.” (Furceri and Loungani, 2018) “The results suggest that the challenge now facing many emerging and developing countries is how to sustain the reductions in inequality achieved since the early 2000s, given the decline in commodity prices since 2015, and the social and economic repercussions of the COVID-19 pandemic”, the paper adds.
Click here to read the full paper.
In an upcoming publication for World Development titled, ‘The correlates of declining income inequality among emerging and developing economies during the 2000s’ (2022), author Edward Anderson of the University of East Anglia discusses patterns that were frequently observed in countries that experienced declining levels of income inequality.
Among the most significant results of the paper, one states that “the tendency toward declining inequality in the 2000s was stronger in countries with higher initial levels of inequality and larger increases in relative agricultural productivity,
Posted by at 12:16 PM
Labels: Inclusive Growth
Sunday, January 2, 2022
The new consensus of economists is further to the left
They say economists rarely agree on one thing.
However, now this statement may not hold true as before. Based on a survey of members of the American Economic Association, a paper by Doris Geide-Stevenson and Alvaro La Parra Perez of the Weber State University compares the academic positions of economists over four decades.
“The main result is an increased consensus on many economic propositions, specifically the appropriate role of fiscal policy in macroeconomics and issues surrounding income distribution. Economists now embrace the role of fiscal policy in a way not obvious in previous surveys and are largely supportive of government policies that mitigate income inequality. Another area of consensus is concern with climate change and the use of appropriate policy tools to address climate change.”
Click here to download the paper and here to be a part of the discussion on it.
They say economists rarely agree on one thing.
However, now this statement may not hold true as before. Based on a survey of members of the American Economic Association, a paper by Doris Geide-Stevenson and Alvaro La Parra Perez of the Weber State University compares the academic positions of economists over four decades.
“The main result is an increased consensus on many economic propositions, specifically the appropriate role of fiscal policy in macroeconomics and issues surrounding income distribution.
Posted by at 10:33 AM
Labels: Inclusive Growth, Macro Demystified
Subscribe to: Posts