Showing posts with label Global Housing Watch. Show all posts
Friday, December 10, 2021
Housing View – December 10, 2021
On cross-country:
- Interest rate hikes will not dim the allure of property. Whatever the gyrations of the markets, most of us seem to have an innate fondness for real assets – FT
- Gentrification and Affordable Housing Policies – CEPA
On the US:
- Rise in U.S. house prices to halve next year, affordability to worsen – Reuters poll – Reuters
- Top Housing Markets for 2022 – Realtor.com
- Zillow’s Hot Housing Takes for 2022 – Zillow
- Despite low mortgage rates, America’s housing market keeps many first-time buyers on the sidelines – Market Watch
- Black and Hispanic renters experience discrimination in almost every major American city. A new study finds that property managers in Chicago, Los Angeles, Louisville, Houston, and Providence are least likely to answer prospective Black and Hispanic tenants – Vox
- Is the Chance to Turn Hotels Into Affordable Housing Slipping Away? As many of the city’s hotels sat empty during the pandemic and homelessness continued to rise, some saw an opportunity to solve both problems. So what happened? – New York Times
- Housing Affordability in the Wake of COVID-19. Regional Solutions for Southern California – Berkeley
- Why is the Biden administration increasing the cost of building houses? – NPR
- Playing Catch-up: Putting the Recent Home Building “Boom” in Context. – Zillow
- You Won’t be My Neighbor: Opposition to High Density Development – Sage Journals
- Biden administration to target money laundering in US real estate market. Anti-corruption drive could raise scrutiny of all-cash commercial and residential property transactions – FT
- It Took More Than Fannie and Freddie to Set Off the Housing Crash. Don’t let the other actors off the hook. – Wall Street Journal
- I changed my mind on rent control. Rent control won’t fix the housing crisis. It’s still a good idea. – Vox
- The FHFA’s Equitable Housing Finance Plans for Fannie Mae and Freddie Mac – Urban Institute
- Assessment Frequency and Equity of the Real Property Tax: Latest Evidence from Philadelphia – Philadelphia Fed
- What can a mortgage market crisis in Ireland teach the U.S.? Boston Fed paper looks at results of approach that gave banks more freedom to modify loans – Boston Fed
On China
- Amid Evergrande crisis, more Chinese developers to issue ABS – Reuters
- China property debt crisis puts founders on spot – Reuters
On other countries:
- [Australia] Booming house prices driving massive increase in size of inheritances to $120bn a year. Report finds that despite helping the rich Australians get richer, inheritances are also shrinking relative inequality by giving a boost to poorer households – The Guardian
- [Australia] Australian house prices will keep rising and it’s truly depressing for those hoping to get into the market. Property prices look set to continue to grow for many more months to come – and certainly at a rate faster than wages – The Guardian
- [Canada] Toronto Home Prices Rise 22% to Record With Supply Vanishing – Bloomberg
- [Canada] Red-hot Canadian property market to lose some steam in 2022: Reuters poll – Reuters
- [Denmark] Claudia Buch: A decade of macroprudential policy – Central Bank of Denmark
- [India] Indian house prices to lag inflation; affordability to improve – Reuters
- [Ireland] An Overview of the Irish Housing Market and Policy – Government of Ireland
- [New Zealand] New Zealand central bank says low net migration could cool housing prices. Easing of soaring property costs may affect RBNZ rate rise forecast next year, says deputy governor – FT
- [United Arab Emirates] Dubai property prices to get boost next year from foreign demand – Reuters
- [United Kingdom] London developers target old offices at risk of becoming stranded assets. Tighter efficiency rules leave owners of older buildings with choice of costly refurbishment or selling at a discount – FT
- [United Kingdom] UK house prices rise at fastest pace in 15 years. Record property values driven by limited housing stock and low lending rates as London market lags – FT
- [United Kingdom] British housing boom created £3tn ‘unearned’ and ‘unequal’ windfall. Resolution Foundation calls for review of tax treatment of main residences to tackle disparities caused by untaxed gains – FT
- [United Kingdom] U.K. House Prices Keep Rising on a Dearth of Supply – Bloomberg
On cross-country:
- Interest rate hikes will not dim the allure of property. Whatever the gyrations of the markets, most of us seem to have an innate fondness for real assets – FT
- Gentrification and Affordable Housing Policies – CEPA
On the US:
- Rise in U.S. house prices to halve next year, affordability to worsen – Reuters poll – Reuters
- Top Housing Markets for 2022 – Realtor.com
- Zillow’s Hot Housing Takes for 2022 – Zillow
Posted by at 5:00 AM
Labels: Global Housing Watch
Wednesday, December 8, 2021
Where is Standard of Living the Highest? Local Prices and the Geography of Consumption
From a NBER paper by Rebecca Diamond and Enrico Moretti:
“Income differences across US cities are well documented, but little is known about the level of standard of living in each city—defined as the amount of market-based consumption that residents are able to afford. In this paper we provide estimates of the standard of living by commuting zone for households in a given income or education group, and we study how they relate to local cost of living. Using a novel dataset, we observe debit and credit card transactions, check and ACH payments, and cash withdrawals of 5% of US households in 2014 and use it to measure mean consumption expenditures by commuting zone and income group. To measure local prices, we build income-specific consumer price indices by commuting zone. We uncover vast geographical differences in material standard of living for a given income level. Low-income residents in the most affordable commuting zone enjoy a level of consumption that is 74% higher than that of low-income residents in the most expensive commuting zone.
We then endogenize income and estimate the standard of living that low-skill and high-skill households can expect in each US commuting zone, accounting for geographical variation in both costs of living and expected income. We find that for college graduates, there is essentially no relationship between consumption and cost of living, suggesting that college graduates living in cities with high costs of living—including the most expensive coastal cities—enjoy a standard of living on average similar to college graduates with the same observable characteristics living in cities with low cost of living—including the least expensive Rust Belt cities. By contrast, we find a significant negative relationship between consumption and cost of living for high school graduates and high school drop-outs, indicating that expensive cities offer a lower standard of living than more affordable cities. The differences are quantitatively large: High school drop-outs moving from the most to the least affordable commuting zone would experience a 26.9% decline in consumption.”
From a NBER paper by Rebecca Diamond and Enrico Moretti:
“Income differences across US cities are well documented, but little is known about the level of standard of living in each city—defined as the amount of market-based consumption that residents are able to afford. In this paper we provide estimates of the standard of living by commuting zone for households in a given income or education group, and we study how they relate to local cost of living.
Posted by at 12:59 PM
Labels: Global Housing Watch, Inclusive Growth
Tuesday, December 7, 2021
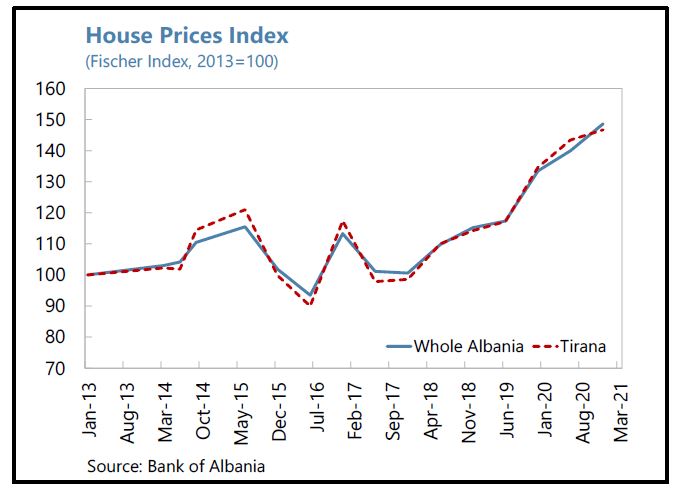
Housing Market in Albania
From the IMF’s latest report on Albania:
“Enhanced surveillance of the fast-growing real estate market is needed. Housing price growth has averaged 11 percent annually since 2018, driven by prices in Tirana and coastal areas. Mortgages account for 64 percent of household loans and construction loans account for 13 percent of total loans to enterprises. Staff encouraged the authorities to address data gaps in the real estate market and develop indicators to closely monitor the potential impact of the sector on financial stability.”
Posted by at 1:46 PM
Labels: Global Housing Watch
Monday, December 6, 2021
Housing Market in Australia
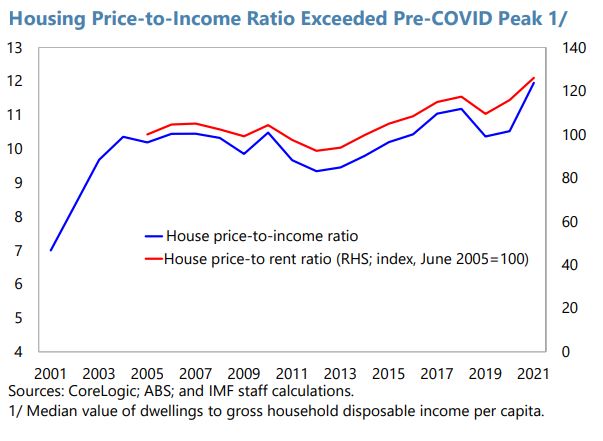
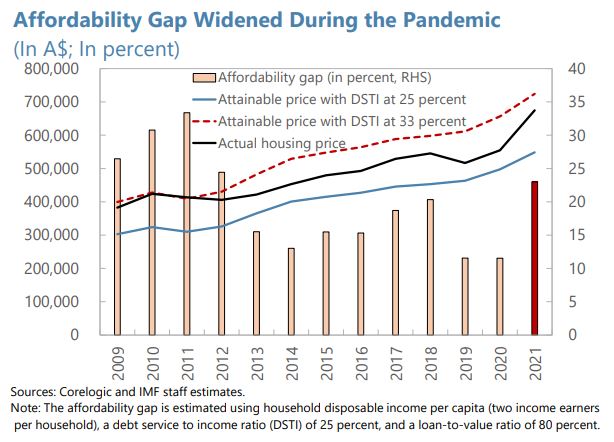
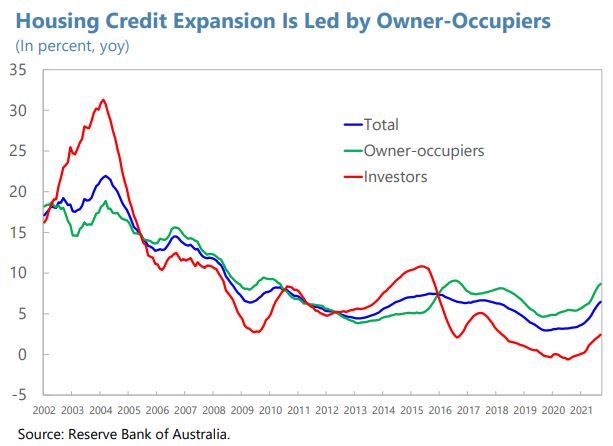
From the IMF’s latest report on Australia:
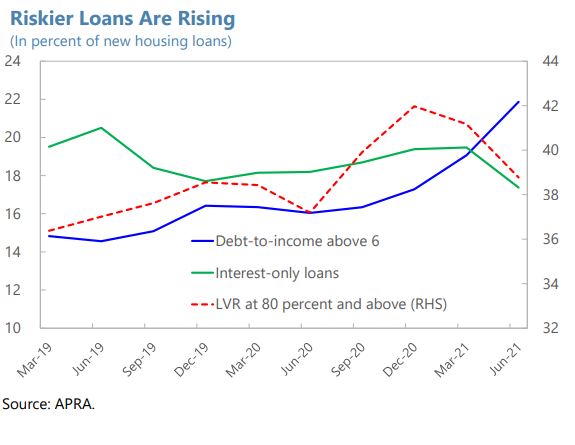
“Housing affordability has deteriorated, and financial risks are building. The housing price-to-income and price-to-rent ratios have risen and exceed pre-COVID peaks. The affordability gap has widened. Housing credit growth is accelerating, reaching 6.5 percent (y/y) in September, driven by owner-occupiers (8.7 percent), with investor loans picking up from a low base (2.4 percent). The risk profile of new loans is deteriorating, as the share of borrowers with high debt-to-income ratios surged from 16 percent pre-COVID to 22 percent.
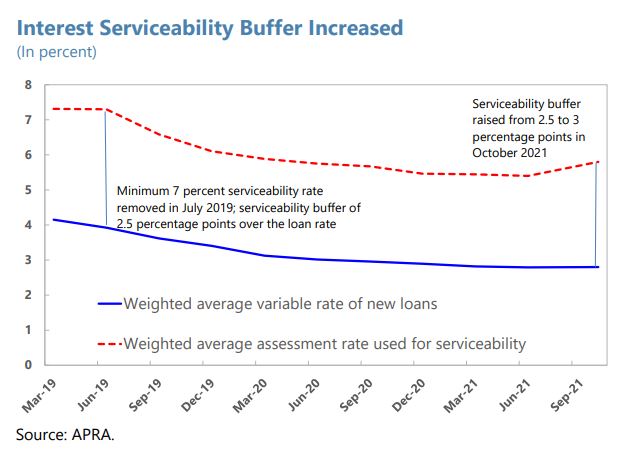
Macroprudential policy has responded to the changing risk environment. In October 2021, APRA raised the minimum serviceability buffer from 2.5 to 3 percent, requiring lenders to use the higher interest rate spread in assessing borrowers’ ability to service their mortgage loans, thereby strengthening their repayment capacity in case of shocks, such as rising interest rates or income loss.
Staff’s Views
The recent tightening of macroprudential policy is appropriate, and additional measures should be considered if financial-stability risks continue rising. While the surge in house prices has been driven largely by owner-occupiers taking advantage of low mortgage rates and fiscal support programs, high debt-to-income mortgages are on the rise amid elevated household debt, and investor demand has begun to increase from low levels. Lending standards should be monitored closely. With about 70 percent of mortgages at variable rates, borrowers are exposed to rate increases with the expected monetary policy normalization in the medium term. Further macroprudential tightening may be warranted if housing debt continues to outpace income growth and the rise in housing prices leads to increased riskiness of mortgage lending. Options include instituting portfolio restrictions on debt-to-income (DTI) and loan-to-value ratios (LVR), with DTI restrictions likely more effective in curbing investor demand, while LVR restrictions would affect more liquidity-constrained owner-occupiers, in particular first home buyers.
Housing structural reforms are critical for supporting affordability. Supply-side reforms, including more efficient planning, zoning, and better infrastructure, could improve housing supply. Commonwealth and state/territory governments should consider providing more financial incentives for local governments to streamline zoning regulations and improve infrastructure. Promoting flexible work arrangements could allow workers to move away from capital cities, improving affordability. In addition, governments should focus on providing targeted fiscal support for low-income households and expand social housing. This could be complemented by tax reforms to discourage leveraged housing investment.
Authorities’ Views
The authorities stressed that rising risks in home lending motivated the recent macroprudential tightening. They noted that, while lending standards have generally remained prudent, rapid credit growth that outpaces household income growth could build financial vulnerabilities, while the strength of the house price cycle could give rise to more risk-taking and potential erosion of lending standards. They underscored that they would continue to closely monitor trends in residential mortgage lending and were prepared to take further measures if needed. They confirmed that other policy instruments, including DTI and LVR restrictions, could be deployed if necessary. The authorities thought that tax policy was not the right tool to address potential speculative behavior in housing markets, as negative gearing and the capital gains tax discount apply across investments and investments in residential housing are relatively highly taxed, and that macroprudential policy should instead be employed as needed to address financial stability risks.
The authorities agreed that housing supply reform would be important to improve affordability. They highlighted that the Commonwealth has provided funds to support state and local governments in infrastructure provision and concurred that more could be done to promote zoning and planning reforms to boost housing supply. Additional targeted support could also be provided to low-income households to address affordability issues, and the authorities concurred that adequate provision of social housing remained important.”
From the IMF’s latest report on Australia:
“Housing affordability has deteriorated, and financial risks are building. The housing price-to-income and price-to-rent ratios have risen and exceed pre-COVID peaks. The affordability gap has widened. Housing credit growth is accelerating, reaching 6.5 percent (y/y) in September, driven by owner-occupiers (8.7 percent), with investor loans picking up from a low base (2.4 percent). The risk profile of new loans is deteriorating, as the share of borrowers with high debt-to-income ratios surged from 16 percent pre-COVID to 22 percent.
Posted by at 6:03 PM
Labels: Global Housing Watch
Are Your Greenhouse Gas Emissions All About Location, Location, Location?
From the Energy Institute at Haas:
“New research examines the role of individuals versus places in determining household carbon emissions.
The average household in San Francisco emits 36 percent less CO2 from residential and transportation energy use than the average household in Houston. Within the San Francisco Bay Area, the top 10 Census tracts with the highest household carbon emissions emit, on average, 5.6 times more per capita than the 10 lowest emissions Census tracts. Researchers and policy makers have recently highlighted the tremendous spatial variation in household carbon emissions, both within and across cities. See e.g. here and here.
Some of these differences can be explained by household characteristics, such as household size and income; some can be explained by gas versus electric heating or type of automobile. The remaining variation has historically been attributed to characteristics of the places themselves and how various amenities (e.g., climate, density, public transit, walkability) correlate with average carbon footprints.
This spatial variability could present an opportunity – perhaps we can learn from these places with low carbon footprints to better design and implement similar policies and practices nationwide in a quest to decarbonize the US economy.
A new paper by the Energy Institute’s own Eva Lyubich, available here as a new Energy Institute working paper, explores these issues in detail. The starting point of her paper is to recognize that people make choices about where they live, so different types of people live in different types of cities. Some people want to live in cities where they can drive to work, others prefer to commute via public transit or bike or walking. Some people want to live in a 3-bedroom house with a yard and others prefer an apartment building near lots of other people and restaurants. Through this lens, one quickly starts to realize that a lot of the differences we see in household carbon emissions across the US come from a mix of the characteristics of a particular place and the characteristics and preferences of people who choose to live there.”
Continue reading here.
From the Energy Institute at Haas:
“New research examines the role of individuals versus places in determining household carbon emissions.
The average household in San Francisco emits 36 percent less CO2 from residential and transportation energy use than the average household in Houston. Within the San Francisco Bay Area, the top 10 Census tracts with the highest household carbon emissions emit, on average, 5.6 times more per capita than the 10 lowest emissions Census tracts.
Posted by at 12:04 PM
Labels: Global Housing Watch
Subscribe to: Posts