Showing posts with label Global Housing Watch. Show all posts
Monday, November 21, 2016
Global Housing Watch Quarterly Update
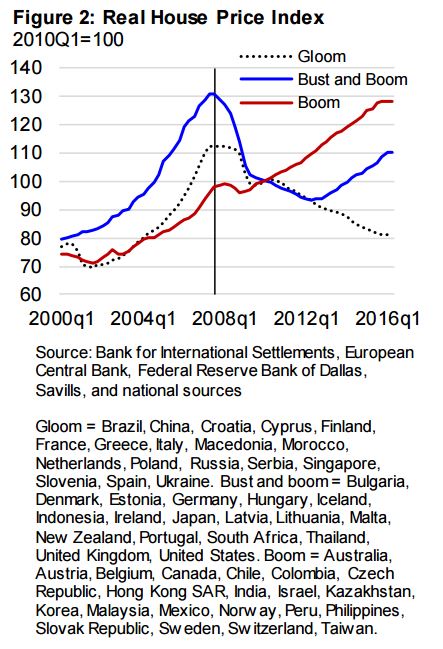
The IMF’s Global House Price Index—an average of real house prices across countries—is now almost back to its level before the financial crisis. The underlying picture is quite varied. Developments in the countries that make up the index fall into three clusters:
- The first cluster—gloom—consists of 18 economies in which house prices fell substantially at the onset of the Great Recession, and have remained on a downward path.
- The second cluster—bust and boom—consists of 18 economies in which housing markets have rebounded since 2013 after falling sharply during 2007-12.
- The third cluster—boom—comprises 21 economies in which the drop in house prices in 2007–12 was quite modest and was followed by a quick rebound
Read the full report for details and IMF assessments of house price valuations in various countries.
The IMF’s Global House Price Index—an average of real house prices across countries—is now almost back to its level before the financial crisis. The underlying picture is quite varied. Developments in the countries that make up the index fall into three clusters:
- The first cluster—gloom—consists of 18 economies in which house prices fell substantially at the onset of the Great Recession, and have remained on a downward path.
Posted by at 2:55 PM
Labels: Global Housing Watch
Thursday, November 17, 2016
Housing Market in Sweden
The IMF’s latest Financial System Stability Assessment on Sweden notes the following:
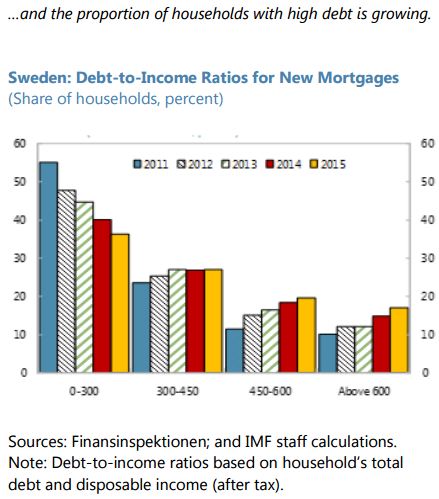
“Housing finance creates vulnerabilities for financial stability due to specific features of Swedish residential mortgages, high household debt, and rising asset prices (…). House prices have risen to high levels, slowing only recently. The price-to-income ratio is 40 percent above its 20-year average, among the highest in advanced economies, raising a red flag. Research suggests that house prices are 12 percent above long-run equilibrium (IMF Working Paper 15/276). House price gains provide incentives for households not to amortize loans and take out even larger loans relative to income, aided by longer loan maturities. Mortgage interest rate deductibility and the lack of a property tax further propel house demand. (…) The pace of housing completions represents less than 1 percent of the housing stock, lagging behind rising population, especially in urban areas. (…) FI’s view is that the rising house prices and high household debt do not entail high credit risk for banks, but they do add to macroeconomic vulnerabilities. (…) High asset valuations do not necessarily lead to asset price declines, but if a fall were to happen, the corrections could be much larger and damaging, especially given the high household debt. (…) Even though households appear resilient, it is challenging to be conclusive about how scenarios of falling asset prices and higher interest rates would play out. (…) The authorities have responded to increasing household debt with macroprudential measures focusing on credit supply (…). The recent amortization requirement and the government’s 22–point proposal for more housing are welcome, but more is needed to address distortions in the housing market.”

The IMF’s latest Financial System Stability Assessment on Sweden notes the following:
“Housing finance creates vulnerabilities for financial stability due to specific features of Swedish residential mortgages, high household debt, and rising asset prices (…). House prices have risen to high levels, slowing only recently. The price-to-income ratio is 40 percent above its 20-year average, among the highest in advanced economies, raising a red flag. Research suggests that house prices are 12 percent above long-run equilibrium (IMF Working Paper 15/276).
Posted by at 4:21 PM
Labels: Global Housing Watch
Thursday, November 10, 2016
Can Property Taxes Reduce House Price Volatility? Evidence from U.S. Regions
A new IMF Working Paper by Tigran Poghosyan “(…) use a novel dataset on effective property tax rates in U.S. states and metropolitan statistical areas (MSAs) over the 2005–2014 period to analyze the relationship between property tax rates and house price volatility. (…) [Poghosyan] find that property tax rates have a negative impact on house price volatility. The impact is causal, with increases in property tax rates leading to a reduction in house price volatility. The results are robust to different measures of house price volatility, estimation methodologies, and additional controls for housing demand and supply. The outcomes of the analysis have important policy implications and suggest that property taxation could be used as an important tool to dampen house price volatility.”
Please note that IMF Working Papers do not represent the official views of the IMF.
A new IMF Working Paper by Tigran Poghosyan “(…) use a novel dataset on effective property tax rates in U.S. states and metropolitan statistical areas (MSAs) over the 2005–2014 period to analyze the relationship between property tax rates and house price volatility. (…) [Poghosyan] find that property tax rates have a negative impact on house price volatility. The impact is causal, with increases in property tax rates leading to a reduction in house price volatility.
Posted by at 4:17 PM
Labels: Global Housing Watch
Wednesday, October 26, 2016
Housing in the U.S.: Affordable or Not?
From the Global Housing Watch Newsletter: October 2016
How do we measure housing affordability? What does the data tell us about the United States? What explains the different patterns? What is the short term outlook? What can policymakers do? These are some of the questions that Svenja Gudell tackles in the November issue of the Global Housing Watch Newsletter. Gudell is the Chief Economist of Zillow and a leading expert on the U.S. housing market.
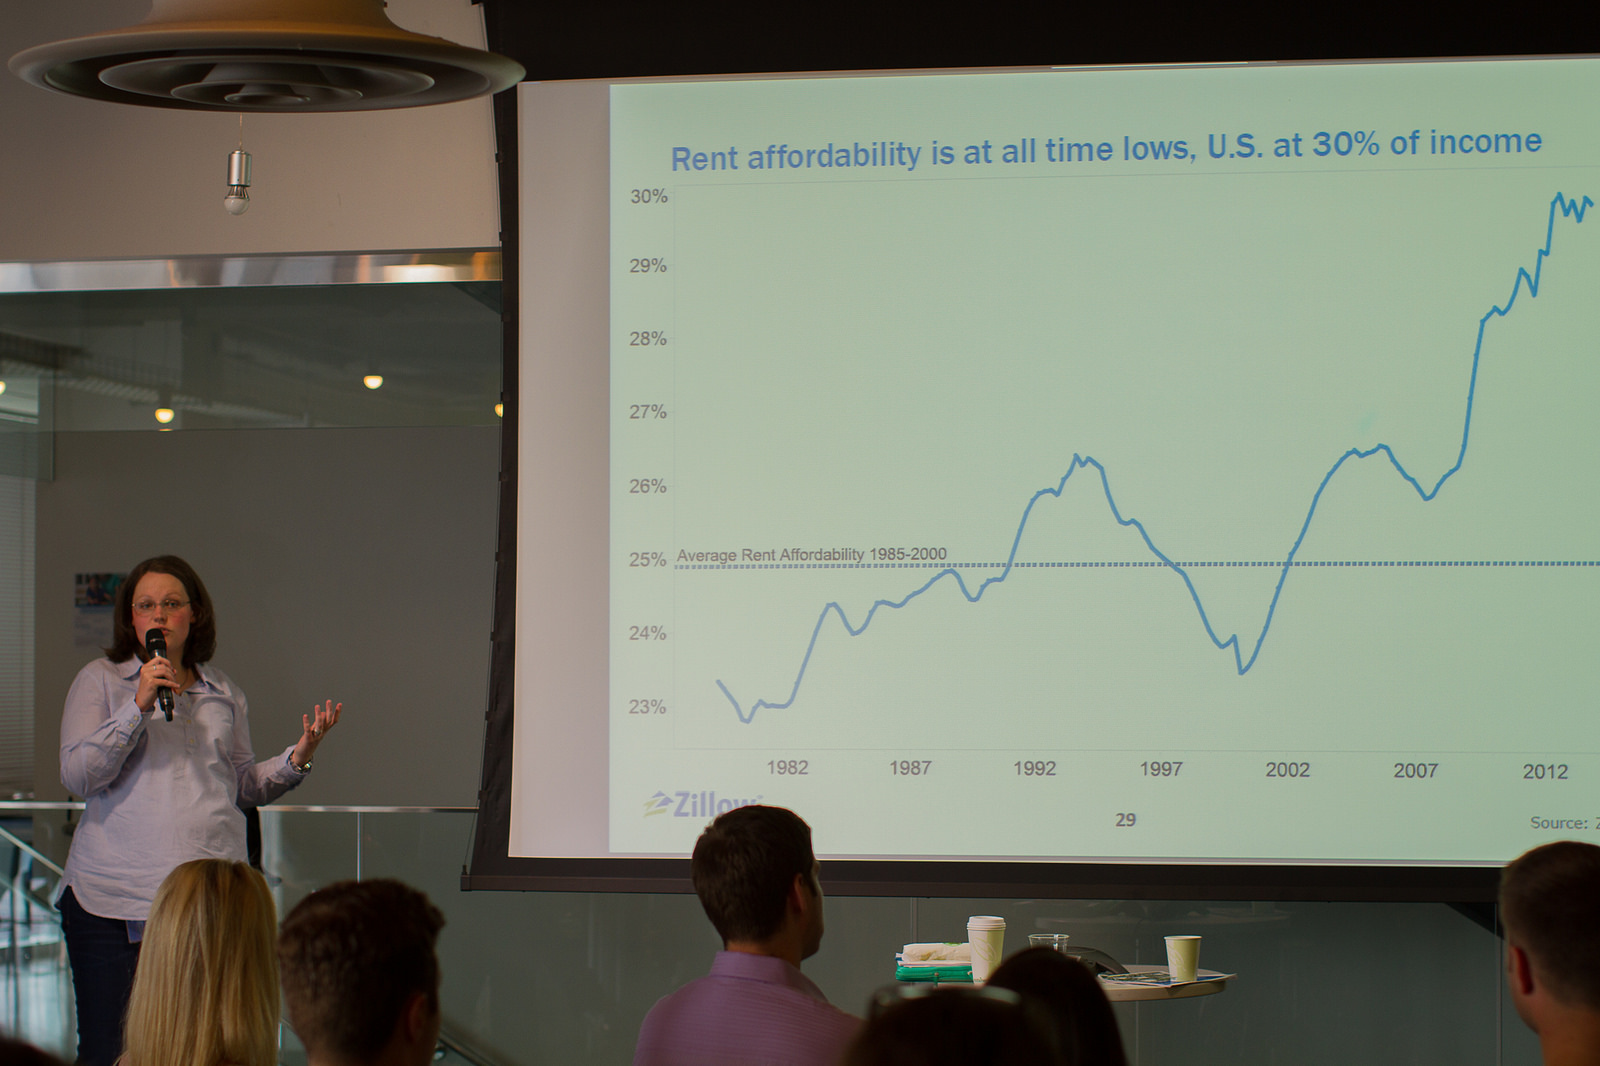
Svenja Gudell presenting housing market data (Photo credit: Adam Cohn)
Hites Ahir: Zillow has a lot of great data on the U.S. housing market and it is available to the public. So how do you track housing affordability?
Svenja Gudell: Zillow’s research frames housing affordability as the percent of someone’s monthly income spent on a mortgage or rental payment. For renters and buyers alike, we assume they make their area’s median annual household income and will be making the area’s median rent or mortgage payment. For home buyers, we make a few basic additional assumptions: that they are making a 20 percent down payment on the median-valued home in their area, and that they are financing their purchase with a conventional, 30-year, fixed-rate mortgage at prevailing mortgage rates as published by Freddie Mac. We publish this data assuming a resident is earning their area’s annual median household income and paying for median housing costs. In addition to considering the median, we also dig a little deeper to look at the tails of the distribution. So for a resident making their area’s median bottom-third household income (the median of the bottom third of the income distribution in that area), we match that buyer with either the mortgage payment of the median bottom-tier home – often a less expensive or entry level home – or the bottom-tier median rental payment. We do the same for the top third of the market, where residents making their area’s median top-third household income, are matched with the median top-third home or rental payment. We calculate all these affordability stats at the metro and city level.
We approach affordability in this way because we feel it provides an intuitive sense for consumers of the actual costs of housing to their household budget each month. It’s easy to communicate, for example, that renting the median home in the Seattle metro will consume 32 percent of a resident’s typical salary each month. More traditional measures of affordability, like price-to-income ratios or price-to-rent ratios, typically only produce a non-specific number that doesn’t tell the consumer very much. For example, the current price-to-income ratio in the Seattle metro is 5.2. In addition, this also doesn’t include the impact a low mortgage rate has on spending power.
Hites Ahir: What do the data show for the national and local level?
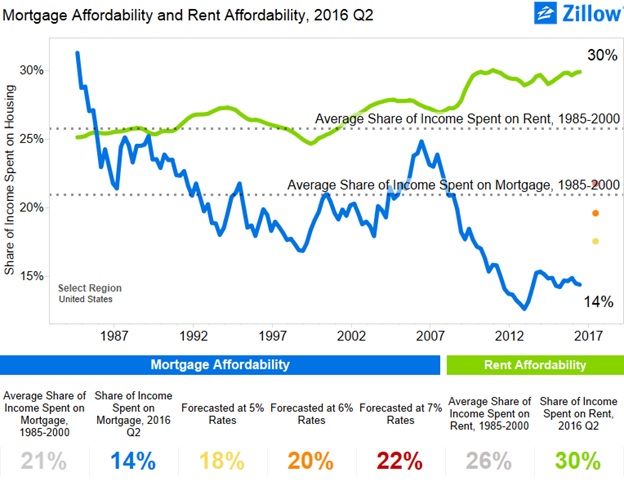
Svenja Gudell: In a general sense, buying a home currently is much more affordable than renting a home. Nationwide, buying the typical U.S. home on the median U.S. household income will consume about 14 percent of your monthly pay. Renting the typical home will consume 30 percent of income. Compared to historic norms, buying a home today is much more affordable than it was in prior decades: from 1985 through 2000, buying a home consumed, on average, about 21 percent of a buyer’s income. For renters, the story is reversed – renting today is much less affordable than it was in the pre-bubble years, when the typical rental consumed about 26 percent of income.
The reason buying a home is so much more affordable today comes down to today’s historically low mortgage interest rates, which help keep monthly mortgage costs low even as home values rise. Today, prevailing mortgage rates are hovering near or below 4 percent, far less than the 8 percent or higher rates that prevailed throughout much of the 1980s and 1990s. Mortgage interest rates will need to rise to roughly 7 percent before buying a home becomes less affordable than it was in the pre-bubble years (given forecasted home values over the next year), giving the overall U.S. housing market lots of headroom before mortgage affordability becomes a widespread concern. Renters, of course, can’t take advantage of low interest rates to help finance their rent, and so as rents have risen, the share of income needed to afford them has also gone up. Rental affordability problems are already emerging in many markets, and look set to only get worse as rents keep rising.
But while affordability looks pretty good at a national level (at least for home buyers) in a handful of very popular, pricey markets, the share of income necessary to afford a typical mortgage is already exceeding historic norms – even with historically low mortgage rates. In the Los Angeles metro, for example, buyers should currently expect to spend 38 percent of their income on a mortgage, up from 35 percent historically. If and when mortgage interest rates rise to 5 percent – a decent jump, but not outside the realm of possibility in the mid-term – Angelenos looking to buy a home should expect to spend almost half (46 percent) of their income on a mortgage. Renters in the L.A. area are already spending almost half their incomes on a typical rental payment (48 percent), and this share will only rise as rents keep going up at a faster pace than incomes. We see similar stories in other hot California markets, including San Diego and the Bay Area. In the long-run, these kinds of trends aren’t sustainable, and either incomes will need to grow very substantially, or housing costs will eventually need to level off or even come down a bit, in order to keep these communities affordable to typical residents.
Hites Ahir: If we look at housing affordability by income groups, what do the data show?
Svenja Gudell: It’s a lot easier for home buyers and renters at the top of the income distribution than it is for those at the bottom. Currently, those making the median, bottom-third U.S. household income and looking to buy the median, bottom-third/entry-level U.S. home should expect to pay roughly twice the share of their income toward a mortgage as those making the typical top-third income and buying a top-third home. In very expensive areas, like the San Francisco Bay Area, lower-income buyers should expect to pay almost 70 percent of their income toward a mortgage on an entry-level home. Essentially, in an area like San Francisco, it’s virtually impossible to afford housing costs on a low income and also afford all the rest of life’s necessities.
For lower-income renters, the situation is even more dire. Again in the Bay Area, a lower-income renter looking to rent even a less-expensive, bottom-third rental home will need to pay more than 86 percent of their income on rent – more than three times as much as a higher-income peer renting a more expensive, top-third home. Realistically, lower-income renters need to find multiple roommates to help shoulder this kind of burden; or try to work longer hours or find a second (or third) job to make ends meet.
Hites Ahir: What explains these patterns?
Svenja Gudell: Housing affordability is essentially defined by two basic factors: income and housing costs. If income rises at roughly the same pace as housing costs, then affordability doesn’t change much. If income growth exceeds growth in housing costs, then affordability can be expected to improve, in a general sense. If incomes stay flat or fall, but housing costs rise, then housing affordability will suffer. (Assuming relatively stable mortgage rates on the mortgage affordability side. As mortgage rates rise, affordability will also worsen, all else equal, as housing costs will rise.)
Over the past decade-plus, incomes at the upper end of the distribution have risen strongly, but incomes for the lowest earners have barely budged. At the same time, housing costs have risen fairly steadily over the past few years – especially rents, which largely did not see the big drop during the recession that home values did, and instead kept chugging upward. Exacerbating the problem at the lower-end of the market is the fact that bottom-tier home values are increasing at roughly double the pace of top-tier home values. This is largely attributable to low supply of homes for sale overall, especially at the bottom end of the market, and very high demand for those homes that are available. Investors, cash buyers and “regular” buyers alike are all competing for these homes, pushing prices up – which in turn contributes to mounting affordability issues.
Hites Ahir: In a recent article, you looked into the link between the housing bust and inequality. What did you find?
Svenja Gudell: The housing bust disproportionately impacted homeowners in lower-tier, less expensive homes – the share of entry-level homes foreclosed upon since 2006 is roughly three times the share of higher-end homes foreclosed upon over the same time. Most of these homes were foreclosed upon simply because their owners had less means to absorb some of the financial shocks of the recession, like a lost job. And those that were able to hang onto their homes often slid into negative equity, in which their home was worth less than the outstanding mortgage balance on it, making it virtually impossible to sell without a complicated, lengthy and costly short sale or mortgage modification. Once in negative equity – sometimes very deep – many of these homeowners simply gave up and let their home fall into foreclosure rather than keeping up with a mortgage and throwing good money after bad, exacerbating the foreclosure problem.
But in the years following the recession, the value of foreclosed homes climbed dramatically. Investors and cash buyers scooped them up to turn them into rentals, along with natural demand from first-time buyers and recent renters. Throughout the entire recovery, foreclosed homes showed greater annual appreciation than homes in general, peaking at 12.4 percent in January 2014, and falling to 6.8 percent by April 2016. Overall median U.S. home values, over the same time, reached a high of 7.9 percent annual growth in April 2014, with growth slowing to a pace of 4.9 percent by April 2016. Homeowners that were foreclosed upon, then, missed out on this opportunity to see large gains in their personal wealth as their home values grew. Their wealthier peers, able to purchase these homes at the bottom of the market and convert them into rentals, or homeowners that were able to hang on to their homes during the recession, only saw their wealth grow.
There is no small amount of irony in the fact that, after foreclosure, many former homeowners were prohibited from buying again with a mortgage for seven years, and so millions were forced to rent the exact same kind of homes they had owned only a few years prior. What’s more, these homeowners exchanged the relative stability and predictability of a monthly mortgage payment for the instability of rent.
And there’s still more salt to throw on the wound with the benefit of hindsight. It’s likely that millions of hardworking Americans found ways to hold on to their homes through the first few years of the recession, only to be foreclosed upon later – which actually turned out worse for them than simply giving the home up in the early years. A homeowner who foreclosed on a home in 2007 would have theoretically been able to buy again in 2014, and may have realized some of the gains in housing of the past few years. But a homeowner that held out desperately only to finally succumb to foreclosure in 2010 or 2011, won’t be able to buy again until 2017 or 2018.
Hites Ahir: In the short run, will housing affordability deteriorate or improve?
Svenja Gudell: We got some encouraging news recently that incomes last year rose at roughly the same pace as housing costs, a strong year of growth after years of stagnant or even falling wages. At a minimum, this kind of growth should at least mean that housing affordability maintains its current status quo, and doesn’t get worse. It’s good news, but one strong year of income growth isn’t enough to make up for several more years of low/no growth, coupled with very steady growth in housing costs. For housing affordability to meaningfully improve for most Americans – particularly renters – incomes will need to show solid growth for several more years to come. In addition, slowing home value appreciation and rental appreciation will help give incomes a chance to catch up.
Hites Ahir: What can policymakers do to address housing affordability issues? Are there any success stories that we can learn from?
Svenja Gudell: Solving housing affordability issues from a federal level is tricky, since so much of what determines housing affordability and the ability to build/maintain affordable housing is determined at a local level. In a general sense, policies which continue to promote job and wage growth will – obviously – help. Cutting down some of the local and regional barriers to creating affordable housing, like zoning constraints, permitting timelines and effective transit from areas with affordable housing to areas with abundant jobs will also help. Places where its relatively easy to build new housing – like Houston, for example – have succeeded in keeping housing affordable in a general sense, and there are lessons to be learned from their successes. Of course, not every market has as much physical room to grow as Houston or other wide-open areas in the middle of the country, so there is no “one size fits all” approach.
From the Global Housing Watch Newsletter: October 2016
How do we measure housing affordability? What does the data tell us about the United States? What explains the different patterns? What is the short term outlook? What can policymakers do? These are some of the questions that Svenja Gudell tackles in the November issue of the Global Housing Watch Newsletter. Gudell is the Chief Economist of Zillow and a leading expert on the U.S.
Posted by at 5:30 PM
Labels: Global Housing Watch
Thursday, September 29, 2016
Macroprudential Policy in Ireland
“The Central Bank of Ireland’s analysis of systemic vulnerabilities is sophisticated and timely. The Central Bank of Ireland has the power to request data directly from regulated entities, and also has powers to require information from unregulated entities under the Central Bank Acts. The Central Bank of Ireland also has powers to change the levels and regulatory perimeter of macroprudential instruments under national law, such as the LTV and LTI limits. There is a dedicated division (Financial Stability Division) that leads systemic risk analysis and macroprudential policy discussions. The biannual Macro-Financial Review (MFR) covers well the stability of individual sectors and property markets. There is, however, still room for further improvement, in particular as to filling data gaps. First, information on domestic and cross-border bilateral liability positions of banks and non-bank financial institutions is still incomplete in places. Second, detailed information on important elements of commercial real estate market activities is lacking. Third, balance sheet data for non-financial corporations is not fully available. Fourth, the absence of a comprehensive credit register precludes the Central Bank of Ireland from connecting credit information of borrowers across financial institutions in Ireland. Moreover, the Macro-Financial Review can usefully cover financial interconnectedness among sectors, as well as within each sector”, according to an IMF report on Ireland.
“The Central Bank of Ireland’s analysis of systemic vulnerabilities is sophisticated and timely. The Central Bank of Ireland has the power to request data directly from regulated entities, and also has powers to require information from unregulated entities under the Central Bank Acts. The Central Bank of Ireland also has powers to change the levels and regulatory perimeter of macroprudential instruments under national law, such as the LTV and LTI limits. There is a dedicated division (Financial Stability Division) that leads systemic risk analysis and macroprudential policy discussions.
Posted by at 2:11 PM
Labels: Global Housing Watch
Subscribe to: Posts