


Monday, February 3, 2020
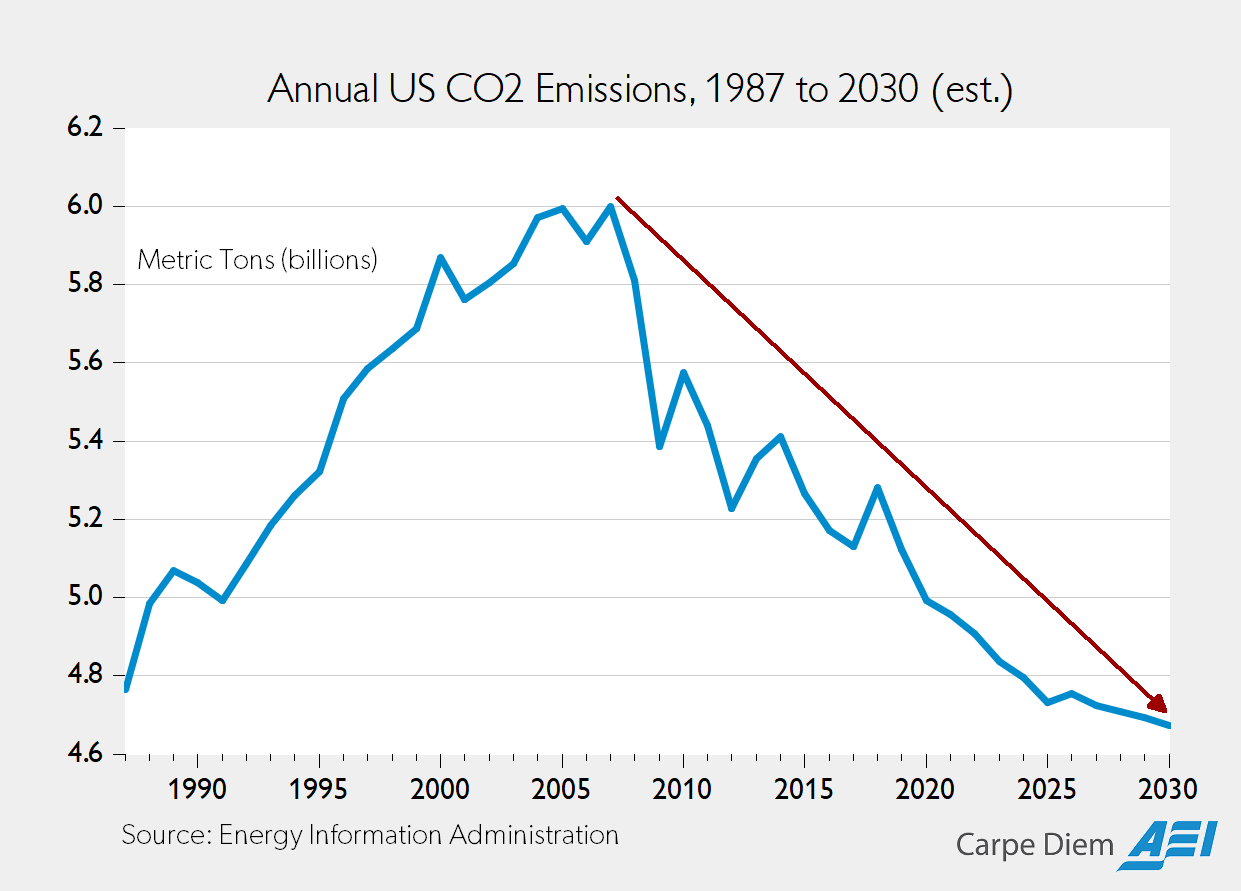
Annual US CO2 Emissions, 1987 to 2030 (est.)
Posted by at 11:17 AM
Labels: Energy & Climate Change
Guyana: Housing Market and Implications for Macroprudential Policies
From the IMF’s latest report on Guyana:
“Guyana’s residential real estate prices have been rising, particularly in the capital city Georgetown, following the discovery of oil in 2015. In line with the growing demand for housing, commercial banks’ housing loans have increased, prompting higher household debt. This paper presents two analyses which suggest that housing prices in Georgetown and banks’ lending to the housing sector appear to be in their early stages of growth. However, given the data limitations and caveats that underpin the analyses, the findings could also indicate early signals of possible risks. Further data collection would support surveillance and deeper studies. At the same time, enhancing prudential measures would help safeguard financial and macroeconomic stability. These include strengthening the monitoring of the housing market, bank lending practices and household debt, as well as fortifying the macroprudential framework, including with more effective toolkits for early intervention.”
From the IMF’s latest report on Guyana:
“Guyana’s residential real estate prices have been rising, particularly in the capital city Georgetown, following the discovery of oil in 2015. In line with the growing demand for housing, commercial banks’ housing loans have increased, prompting higher household debt. This paper presents two analyses which suggest that housing prices in Georgetown and banks’ lending to the housing sector appear to be in their early stages of growth.
Posted by at 11:14 AM
Labels: Global Housing Watch
Friday, January 31, 2020
Housing View – January 31, 2020
On cross-country:
- New Risk to World Economy: Synchronized Housing Slowdown – Wall Street Journal
On the US:
- Refinancing Boom Fuels Mortgages to Postcrisis Record – Wall Street Journal
- Housing speculation and its economic consequences – VOX
- Texas Housing Insight – Real Estate Center Texas A&M University
- Average U.S. Home Seller Profits Hit $65,500 in 2019, Another New High – ATTOM Data Solutions
- The Trump administration’s new housing rules will worsen segregation – Economic Policy Institute
- The Folly Of Bernie Sanders’ National Rent Control Proposal – Cato
- Everything You Think You Know About Housing Is Probably Wrong – New York Times
- Concentration in Mortgage Markets: GSE Exposure and Risk-Taking in Uncertain Times – Federal Reserve Bank of Philadelphia
On other countries:
- [Cambodia] Cambodia has oversupply of housing market – Global Property Guide
- [Finland] Housing market in Finland stays weak – Global Property Guide
- [Puerto Rico] Puerto Rico’s housing market bounced back strongly – Global Property Guide
- [United Arab Emirates] Dubai steps up efforts to revive property market – Financial Times
- [United Kingdom] Number of young homeowners catches up with private renters once more – Financial Times
- [Vietnam] Positive outlook for Vietnam’s property market – Global Property Guide
On cross-country:
- New Risk to World Economy: Synchronized Housing Slowdown – Wall Street Journal
On the US:
- Refinancing Boom Fuels Mortgages to Postcrisis Record – Wall Street Journal
- Housing speculation and its economic consequences – VOX
- Texas Housing Insight – Real Estate Center Texas A&M University
- Average U.S. Home Seller Profits Hit $65,500 in 2019,
Posted by at 5:00 AM
Labels: Global Housing Watch
Thursday, January 30, 2020
Six Charts Explain South Africa’s Inequality
From an IMF article:
“South Africa suffers among the highest levels of inequality in the world when measured by the commonly used Gini index. Inequality manifests itself through a skewed income distribution, unequal access to opportunities, and regional disparities. Low growth and rising unemployment have contributed to the persistence of inequality.
The South African government has used different tools to tackle the stubborn levels of inequality that have plagued the country, including through progressive fiscal redistribution.
Efforts to reduce inequality have focused on higher social spending, targeted government transfers, and affirmative action to diversify wealth ownership and promote entrepreneurship among the previously marginalized. These measures need to be complemented with reforms that promote private investment, jobs, and inclusive growth.
Here are six charts that tell the story of South Africa’s inequality:
Inequality has remained stubbornly high. South Africa started the 1990s with already elevated inequality as the policy of apartheid excluded a large swath of the population from economic opportunities. South Africa’s Gini—an index that measures inequality—has increased further in the early 2000s and has remained high ever since. Meanwhile, its peers have been able to make inroads in reducing inequality.
Income distribution remains highly skewed. The top 20 percent of the population holds over 68 percent of income (compared to a median of 47 percent for similar emerging markets). The bottom 40 percent of the population holds 7 percent of income (compared to 16 percent for other emerging markets). Similar trends can be observed across other measures, such as the income share of the top 1 percent.


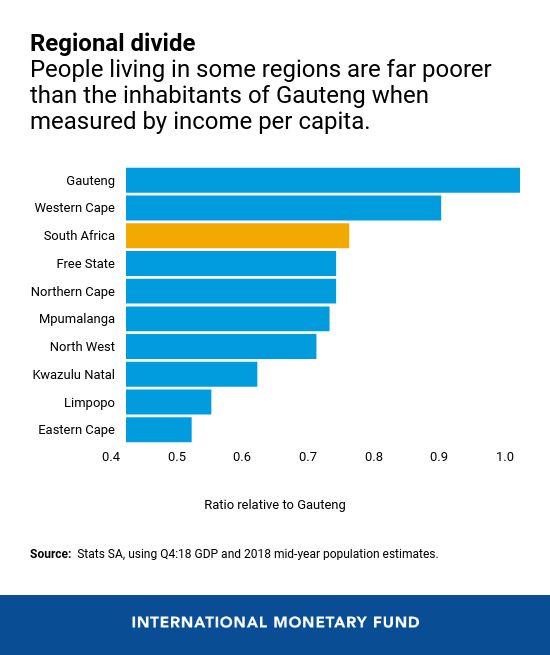
Significant disparities remain across regions. Income per capita in Gauteng—the main economic province that comprises large cities like Johannesburg and Pretoria—is almost twice the levels as that found in the mostly rural provinces like Limpopo and Eastern Cape. Being close to the economic centers increases job and income prospects.”
From an IMF article:
“South Africa suffers among the highest levels of inequality in the world when measured by the commonly used Gini index. Inequality manifests itself through a skewed income distribution, unequal access to opportunities, and regional disparities. Low growth and rising unemployment have contributed to the persistence of inequality.
The South African government has used different tools to tackle the stubborn levels of inequality that have plagued the country,
Posted by at 11:42 AM
Labels: Inclusive Growth
Friday, January 24, 2020
Housing View – January 24, 2020
On cross-country:
- OECD Affordable Housing Database – OECD
- 16th Annual Demographia International Housing Affordability Survey – Demographia
- The 11 most expensive cities to live in around the world in 2020 – Insider
- Prerequisites to getting Africa’s urbanization ‘right’ – Brookings
On the US:
- The Outlook for Housing – Fed
- Housing Supply Chartbook – Urban Institute
- Slight Gains in 2020 Outlook for Residential Remodeling – Harvard Joint Center for Housing Studies
- Why Manhattan’s Skyscrapers Are Empty – The Atlantic
- How the trade war impacts regional economies and housing markets – Builder
- The slowdown in the US housing market – Central Bank of Spain
- Who’s to blame for high housing costs? It’s more complicated than you think. – Brookings
- Planet Money: Single Women Are Shortchanged In The Housing Market – NPR
- What’s Ahead for the U.S. Housing Market in 2020? – Wharton Business Daily
- Are Housing Markets Still Clearing out the Trash of the Last Bust? – Mises Institute
- Opinion: How unfair mortgage and housing practices affect you and your neighborhood — and what can be done about it – Market Watch
- She Almost Lost Her Home In California’s Wildfires. Instead She Built A $200 Million Business. – Forbes
- Changing supply elasticities and regional housing booms – Bank of England
- Institutional Investors’ Impact on the Housing Market – Urban Institute
- Here’s How Many New Homes It Would Take To Fix The Housing Shortage – Forbes
- Eight ways travelers can fight ‘the Airbnb effect’ on local housing costs – Washington Post
On other countries:
- [China] Magnification of the “China Shock” Through the U.S. Housing Market – VoxChina
- [Hong Kong] Pressure building on rental market amid continued stress – RICS
- [United Arab Emirates] UAE’s housing market remains gloomy – Global Property Guide
- [United Kingdom] Housing equity used to fund home improvements, not future care needs – Financial Times
- [United Kingdom] Evidence and the persistence of mistaken ideas: the case of house prices – mainly macro
On cross-country:
- OECD Affordable Housing Database – OECD
- 16th Annual Demographia International Housing Affordability Survey – Demographia
- The 11 most expensive cities to live in around the world in 2020 – Insider
- Prerequisites to getting Africa’s urbanization ‘right’ – Brookings
On the US:
- The Outlook for Housing – Fed
- Housing Supply Chartbook – Urban Institute
- Slight Gains in 2020 Outlook for Residential Remodeling – Harvard Joint Center for Housing Studies
- Why Manhattan’s Skyscrapers Are Empty – The Atlantic
- How the trade war impacts regional economies and housing markets – Builder
- The slowdown in the US housing market – Central Bank of Spain
- Who’s to blame for high housing costs?
Posted by at 5:00 AM
Labels: Global Housing Watch
Subscribe to: Posts