


Wednesday, April 3, 2019
Housing Market in Kuwait
From the IMF’s latest report on Kuwait:
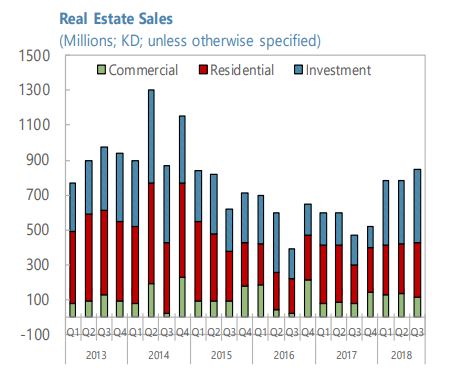
“Real estate is recovering, and equity markets have outperformed regional peers. The sales of investment and residential properties rebounded since mid-2018. Kuwaiti stocks outperformed other Gulf Cooperation Council (GCC) markets, and market capitalization rose, especially following the March 2018 announcement of Kuwait’s inclusion in the FTSE Russell Emerging Market Index.”
From the IMF’s latest report on Kuwait:
“Real estate is recovering, and equity markets have outperformed regional peers. The sales of investment and residential properties rebounded since mid-2018. Kuwaiti stocks outperformed other Gulf Cooperation Council (GCC) markets, and market capitalization rose, especially following the March 2018 announcement of Kuwait’s inclusion in the FTSE Russell Emerging Market Index.”
Posted by at 8:40 AM
Labels: Global Housing Watch
Tuesday, April 2, 2019
Monetary Policy, Growth and Employment in Developing Areas: A Review of the Literature
From a paper by P.N. (Raja) Junankar at University of Technology Sydney;
“In this paper we review the literature on the impact that monetary policy has on growth and employment in developing countries. Much of the literature focusses on the impact of monetary policy on inflation levels and inflation volatility, and sometimes on output (GDP) levels and volatility of output. This survey of the literature on Monetary policy and growth shows that money plays a small role in developing countries and that monetary policy is not a very important influence on growth but may have some impact on inflation. Although there is much discussion about the merits of keeping inflation levels and volatility low, there is very little literature on studying the impact of low rates of steady inflation on the levels of private investment and technological change and hence on economic growth and on employment. There is very little research about the direct links between monetary policy and employment. The impact of growth on employment depends on what are the main drivers of economic growth and the initial state of the economy. Although growth may lead to increasing employment (formal and informal) there is little evidence showing that growth leads to an increase in “decent employment”.”
From a paper by P.N. (Raja) Junankar at University of Technology Sydney;
“In this paper we review the literature on the impact that monetary policy has on growth and employment in developing countries. Much of the literature focusses on the impact of monetary policy on inflation levels and inflation volatility, and sometimes on output (GDP) levels and volatility of output. This survey of the literature on Monetary policy and growth shows that money plays a small role in developing countries and that monetary policy is not a very important influence on growth but may have some impact on inflation.
Posted by at 11:07 AM
Labels: Inclusive Growth
Monday, April 1, 2019
Some US Social Indicators Since 1960
From a new post by Timothy Taylor
“Economic
- Real GDP per person has more than tripled since 1960, rising from $18,036 in 1960 to $55,373 in 2017 (as measured in constant 2012 dollars).
- Inflation has reduced the buying power of the dollar over time such that $1 in 2016 had about the same buying power as 12.3 cents back in 1960, according to the Consumer Price Index.
- The employment/population ratio rose from 56.1% in 1960 to 64.4% by 2000, then dropped to 58.5% in 2012, before rebounding a bit to 62.9% in 2018.
- The share of the population receiving Social Security disabled worker benefits was 0.9% in 1960 and 5.5% in 2018.
- The net national savings rate was 10.9% of GDP in 1960, 7.1% in 1980, and 6.0% in 2000. It actually was slightly negative at -0.5 in 2010, but was back to 2.9% in 2017.
- Research and development spending has barely budged over time: it was 2.52% of GDP in 1960 and 2.78% of GDP in 2017, and hasn’t varied much in between.
Demographic
- The foreign-born population of the US was 9.6 million out of a total of 204 million in 1970, and was 44.5 million out of at total of 325.7 million in 2017.
- In 1960, 78% of the over-15 population had ever been married; in 2018, it was 67.7%.
- Average family size was 3.7 people in 1960, and 3.1 people in 2018.
- Single parent households were 4.4% of households in 1960, and 9.1% of all households in 2010, but slightly down to 8.3% of all households in 2018.
Socioeconomic
- The share of 25-34 year-olds who are high school graduates was 58.1% in 1960, 84.2% in 1980, and 90.9% in 2018.
- The share of 25-34 year-olds who are college graduates was 11% in 1960, 27.5% in 2000, and 35.6% in 2017.
- The average math achievement score for a 17 year-old on the National Assessment of Educational Progress was 304 in 1970, and 306 in 2010.
- The average reading achievement score for a 17 year-old was 285 in 1970 and 286 in 2010.
Health
- Life expectancy at birth was 69.7 years in 1960, and 78.7 years in 2010, and 78.6 years in 2017.
- Infant mortality was 26 per 1,000 births in 1960, and 5.8 per 1,000 births in 2017.
- In 1960, 13.4% of the population age 20-74 was obese (as measured by having a Body Mass Index above 30). In 2016, 40% of the population was obese.
- In 1970, 37.1% of those age 18 and older were cigarette smokers. By 2017, this has fallen to 14.1%.
- Total national health expenditures were 5.0% of GDP in 1960, and 17.9% of GDP in 2017.
Security and Safety
- The murder rate was 5.1 per 100,000 people in 1960, rose to 10.2 per 100,000 by 1980, but had fallen back to 4.9 per 100,000 in 2015, before nudging up to 5.3 per 100,000 in 2017..
- The prison incarceration rate in federal and state institutions was 118 per 100,000 in 1960, 144 per 100,000 in 1980, 519 per 100,000 by 2010, and then down to 464 per 100,000 in 2016.
- Highway fatalities rose from 37,000 in 1960 to 51,000 in 1980, and then fell to 33,000 in 2010, before nudging up to 37,000 in 2017.
Energy
- Energy consumption per capita was 250 million BTUs in 1960, rose to 350 million BTUs per person in 2000, but since then has fallen to 300 BTUs per person in 2017.
- Energy consumption per dollar of real GDP (measured in constant 2009 dollars) was 14,500 BTUs in 1960 vs. 5,700 in 2017.
- Electricity net generation on a per person basis was 4.202 kWh in 1960, had more than tripled to 13,475 kWh by 2000, but since then has declined to 12,326 kWh in 2017.
- The share of electricity generation from renewable sources was 19.7% of the total in 1960, fell to 8.8% by 2005, and since then rose to 17.1% of the total in 2017.
Numbers and comparisons like these are a substantial part of how a head-in-the-clouds academic like me perceives economic and social reality. If you like this kind of stuff, you would probably also enjoy my post from a few years back, “The Life of US Workers 100 Years Ago” (February, 5, 2016).”
From a new post by Timothy Taylor
“Economic
- Real GDP per person has more than tripled since 1960, rising from $18,036 in 1960 to $55,373 in 2017 (as measured in constant 2012 dollars).
- Inflation has reduced the buying power of the dollar over time such that $1 in 2016 had about the same buying power as 12.3 cents back in 1960, according to the Consumer Price Index.
Posted by at 2:41 PM
Labels: Inclusive Growth
As income pie shrinks, Ottawa and business community talk past each other
From Financial Post:
“While economies work better when entrepreneurs and others are allowed to satisfy their greed, big gaps between the richest and the rest can cause chronic problems
Our collective share of the pie shrunk last year.
You might have seen reports that the trade deficit remained an expanse of misery in January. The same day that Statistics Canada released those dreary numbers, it also published its annual report on the distribution of household wealth, or, if you prefer, “Distributions of household economic accounts for income, consumption, saving and wealth of Canadian households, 2018.”
The net worth of households was $10.7 trillion in 2018, compared with $10.9 trillion in 2017; the first decrease since at least 2010, which is when Statistics Canada began publishing this particular set of data.
Collectively, we’re 60 per cent richer than we were a decade ago, so keep that in mind before you take to Twitter to vent about Stephen Harper’s austerity or Justin Trudeau’s taxing of the rich. Still, the good times rolled a little slower last year. That’s partly because the housing bubbles in Toronto and Vancouver started to deflate. But it’s also because a group of wealth creators on which the country has relied since the Great Recession had a tough time in 2018.
Statistics Canada diced household wealth into five income segments. It also divided the aggregate data into five regions. There wasn’t a lot of change in distribution. Nationally, the richest 20 per cent of households controlled about 55 per cent of total wealth, roughly the same as 2010. One shift stood out, however.
(…) “Inequality and fragile growth may be two sides of the same coin,” Ostry, a Canadian who trained at Oxford, the London School of Economics, and the University of Chicago, says in Confronting Inequality: How Societies Can Choose Inclusive Growth, along with co-writers Prakash Loungani and Andrew Berg.
(…) The Trudeau government and the business community keep talking past each other. The latter should recognize that the federal government’s coddling of the middle class isn’t entirely about electioneering. And Trudeau and Morneau should be wary of taking the leaders of the country’s biggest companies for granted. As David Lipton, one of Ostry’s bosses at the IMF once said, “a larger slice of the pie for everyone calls for a bigger pie.”
From Financial Post:
“While economies work better when entrepreneurs and others are allowed to satisfy their greed, big gaps between the richest and the rest can cause chronic problems
Our collective share of the pie shrunk last year.
You might have seen reports that the trade deficit remained an expanse of misery in January. The same day that Statistics Canada released those dreary numbers,
Posted by at 8:50 AM
Labels: Inclusive Growth
Friday, March 29, 2019
Housing Market in Sweden
From the IMF’s latest report on Sweden:
“High housing prices and high market rents increase vulnerabilities and inequality. Despite their recent moderation, house prices have tripled in real terms since the mid-1990s, lifting
the price-to-income (PTI) ratio to almost 30 percent above its 20-year average, with Stockholm’s PTI nearly twice the national average and among the highest worldwide. New purchasers must take on high debts relative to income (DTI), typically at floating rates, a macrofinancial vulnerability (…). Moreover, long queues for rent-controlled apartments meant that those unable to purchase housing had to pay much higher rents on subletted or newly constructed apartments, that are estimated to be 65 percent higher on average. An “insider-outsider” problem arises as labor mobility to the main centers is most impaired for those without parents able to assist with large down payments, impeding growth and exacerbating intergenerational and regional inequality.The “January agreement” includes promising steps but comprehensive housing reforms are needed given the scale of the problem. Key elements of a reform package include:
- Making the rental market work: in addition to fully liberalizing rents of newly constructed apartments, there is a need to phase out existing controls. A common approach is to apply market rents when there is a change in tenant. Access to the housing allowance could be expanded to cushion this adjustment (see below), while also applying a temporary “windfall” tax on significant rental income gains. To help reduce market rents more quickly, rental supply should be increased, such as by reducing impediments to sub-letting and to households renting out their own apartments, while containing macrofinancial risks from buy-to-let housing.
- Taxing property to rebalance the housing market: Sweden’s property tax was capped in 2008 to be among the lowest in the OECD, limiting the cost to households of occupying housing beyond their needs. A broad-based increase in the ceiling on the property tax would be most efficient, but an increase targeted to the main centers could be considered to incentivize mobility where it is most needed. Abolishing the interest on deferrals of capital gains taxes will help ease deterrents to mobility. An additional step to be considered is to tax only a portion of the capital gains on primary dwellings. Implementing a phase out of mortgage interest deductibility—which boosts housing demand and prices—would have limited impact on household finances currently given the low level of interest rates.
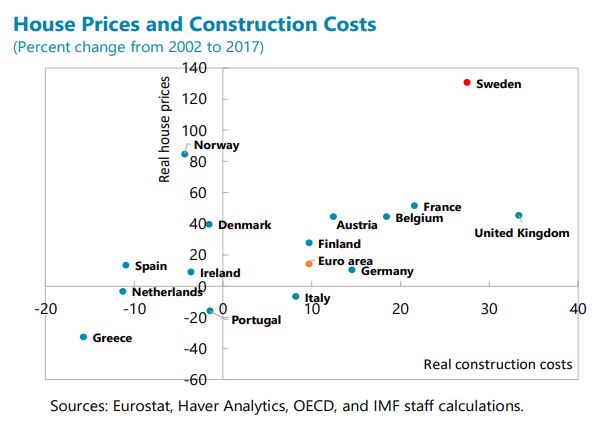
- Producing housing that is affordable: it is important to simplify the planning process to reduce the cost of construction which have risen by over 28 percent in real terms over the past 15 years, compared with 10 percent in the euro area. Productivity in the construction sector should be enhanced by strengthening competition, including by harmonizing land sale procedures across the municipalities and preventing requirements beyond national building standards in the approval process. The government should also expand existing subsidies for construction of affordable rental apartments, together with those for student and elderly housing in view of changing demographics.
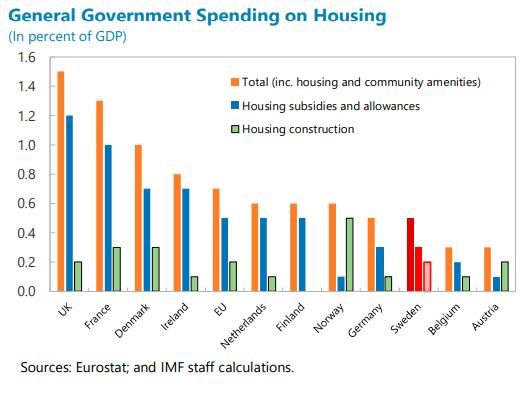
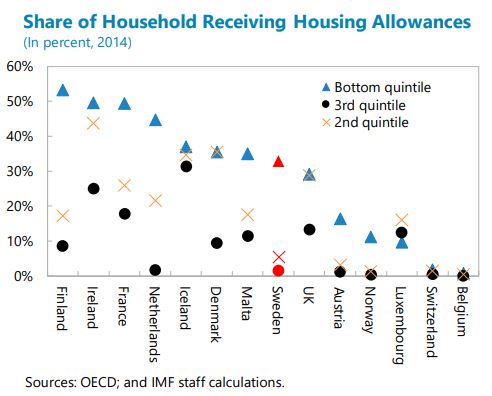
Protecting households in the transition is important to help build broad consensus on comprehensive reforms. On average, the share of rental expenditure in disposable income would increase from 24 percent to 31 percent, with most impact on households in the lowest income decile, which could be cushioned by expanding payments under the existing housing allowance. However, this allowance is seldom paid to households in the second or third income quintiles, contributing to relatively low total expenditure on housing allowances in Sweden. There is a need to review the coverage and amounts of housing allowances to give confidence that a transition to market rents will be manageable.
The authorities recognize the long-standing structural weaknesses in the Swedish housing market. They emphasized that housing policies were politically contentious in Sweden, limiting the feasibility of some reforms that could be most effective in principle, such as raising property taxation. Nevertheless, implementing the measures included in the “January agreement” during the term of the government would represent a step forward.”
From the IMF’s latest report on Sweden:
“High housing prices and high market rents increase vulnerabilities and inequality. Despite their recent moderation, house prices have tripled in real terms since the mid-1990s, lifting
the price-to-income (PTI) ratio to almost 30 percent above its 20-year average, with Stockholm’s PTI nearly twice the national average and among the highest worldwide. New purchasers must take on high debts relative to income (DTI), typically at floating rates,
Posted by at 10:25 AM
Labels: Global Housing Watch
Subscribe to: Posts