


Thursday, June 6, 2019
Housing View – June 6, 2019
On cross-country:
- Making Affordable Housing a Reality in Cities – World Economic Forum
- How Airbnb became key to turning homes into businesses – Financial Times
- European city living gets less affordable – Financial Times
- Architects look to floating cities as sea levels rise – Financial Times
On the US:
- Affordable Housing and City Welfare – NBER
- Cory Booker unveils plan to combat housing ‘affordability crisis’ – CNN, Los Angeles Times and New York Times
- Like college debt and climate change, the housing affordability crisis is generational warfare – Slate
- Charts of the week: Housing markets – Brookings
- Why Some Americans Won’t Move, Even for a Higher Salary – Citylab
- How California’s big plans to address housing affordability crashed – Los Angeles Times
- Escaping the Housing Shortage – Federal Reserve Bank of Kansas City
- How Luxury Units Turn Into Affordable Housing – Citylab
On other countries:
- [China] China Curbs Property Developers’ Funding to Cool Land Prices – Bloomberg
- [Germany] Stress testing the German mortgage market – Deutsche Bundesbank
- [Germany] Germany’s house price growth accelerates – Global Property Guide
- [Hong Kong] Hong Kong’s house price boom is over – Global Property Guide
- [Ireland] Ireland’s house price rises continue, albeit at a much slower pace – Global Property Guide
- [New Zealand] Controlling house price affordability: Look to the rental market – Massey University
- [Portugal] Portugal’s housing market is strengthening – Global Property Guide
- [Slovak Republic] Slovak Republic’s house price rises continue – Global Property Guide
- [Syria] The architects with radical designs for rebuilding Syria – Financial Times
- [United Kingdom] Behind the housing crisis – Property Journal
- [United Kingdom] Is building more houses the answer? – Property Journal
On cross-country:
- Making Affordable Housing a Reality in Cities – World Economic Forum
- How Airbnb became key to turning homes into businesses – Financial Times
- European city living gets less affordable – Financial Times
- Architects look to floating cities as sea levels rise – Financial Times
On the US:
- Affordable Housing and City Welfare – NBER
- Cory Booker unveils plan to combat housing ‘affordability crisis’
Posted by at 3:00 AM
Labels: Global Housing Watch
Wednesday, June 5, 2019
Animated chart of US oil production by state, 1981-2018
From American Enterprise Institute:
“A big thanks to my former AEI colleague Olivier Ballou for helping me find the UK-based website Flourish, which allowed me create the “bar chart race” visualization above showing annual oil production (barrels per day) in the top ten oil-producing states (including federal offshore production) from 1981 to 2018. Perhaps the most interesting trend is to watch the rise of oil production in North Dakota. The state ranked No. 10 until about 2005, when revolutionary drilling and extraction technologies tapped into previously inaccessible shale oil deposits in the Bakken Formation in western North Dakota, and the state then rose to the No. 2 oil-producing US state by 2015 behind only Texas (and offshore production). Also notice the significant declines in conventional oil production in Alaska (from more than 2 million barrels per day in 1988 to below 500,000 bpd by 2014) and California (from more than 1 million bpd in the early 1980s to below 500,000 bpd in 2017).
The Flourish website is pretty user-friendly and I’ll try to produce more “bar chart race” visualizations in the future. If you have any ideas, please leave them in the comment section.”
From American Enterprise Institute:
“A big thanks to my former AEI colleague Olivier Ballou for helping me find the UK-based website Flourish, which allowed me create the “bar chart race” visualization above showing annual oil production (barrels per day) in the top ten oil-producing states (including federal offshore production) from 1981 to 2018. Perhaps the most interesting trend is to watch the rise of oil production in North Dakota.
Posted by at 9:03 AM
Labels: Energy & Climate Change
Monday, June 3, 2019
Stranded! How Rising Inequality Suppressed US Migration and Hurt Those Left Behind
From an IMF working paper by Tamim Bayoumi and Jelle Barkema:
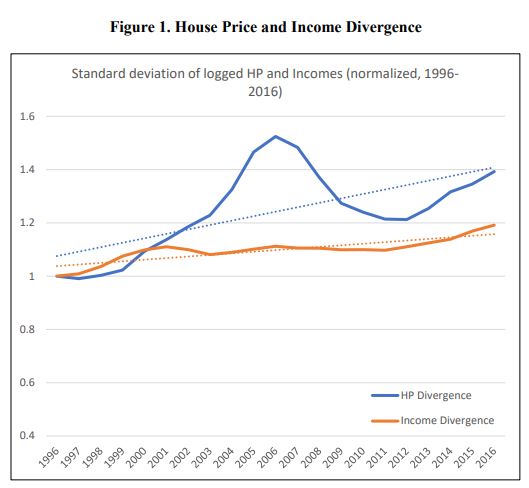
“Using bilateral data on migration across US metro areas, we find strong evidence that increasing house price and income inequality has reduced long distance migration, the type most linked to jobs. For those migrating uphill, from a less to a more prosperous location, lower mobility is driven by increasing house price inequlity, as the disincentives from higher house prices dominate the incentives from higher earnings. By contrast, increasing income inequality drives the fall in downhill migration as the disincentives from lower earnings dominate the incentives from lower house prices. The model underlines the plight of those trapped in decaying metro areas—those “left behind”.”

From an IMF working paper by Tamim Bayoumi and Jelle Barkema:
“Using bilateral data on migration across US metro areas, we find strong evidence that increasing house price and income inequality has reduced long distance migration, the type most linked to jobs. For those migrating uphill, from a less to a more prosperous location, lower mobility is driven by increasing house price inequlity, as the disincentives from higher house prices dominate the incentives from higher earnings.
Posted by at 5:08 PM
Labels: Inclusive Growth
Qatar: Property Market Update
From the IMF’s latest report on Qatar:
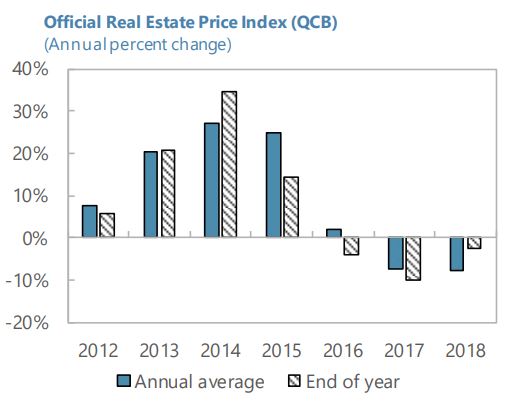
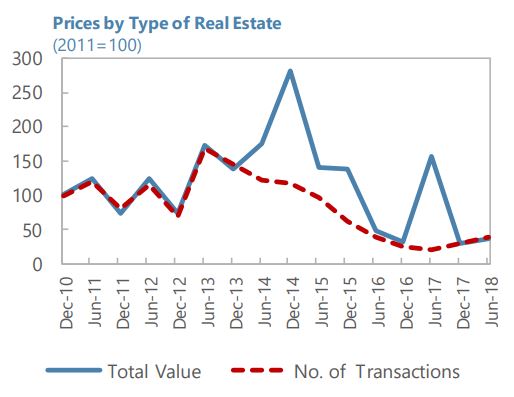
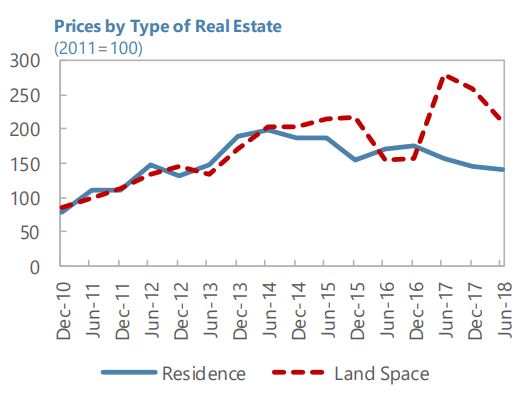
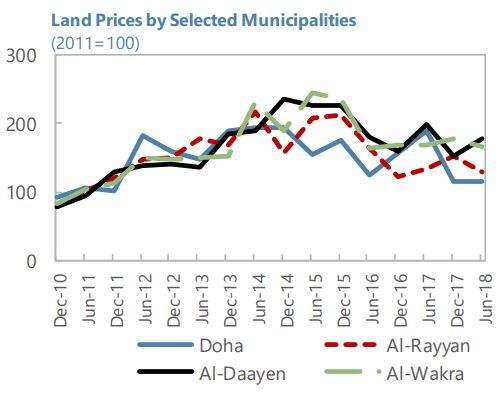
“After a period of rapid growth, real estate prices in Qatar are adjusting to new levels. According to the real estate price index developed by QCB, following an 82 percent increase during 2012–16, real estate prices fell by 15 percent during 2017–18. Data produced by the Ministry of Justice indicate the following trends:
- Both the volume and number of transactions are down since 2013–2014 peak. As prices have decreased, some owners seem to be holding off to their properties rather than selling at depressed prices.
- Land prices are holding up better than properties with a rebound in prices during 2017 before adjustment in 2018. Residence prices have been on a declining trend since mid-2014, though there are signs that the slowdown is flattening.
- In terms of regions, land prices in Al Daayen are holding on better which could be due to the active development of Lusail City and 2022 World Cup projects. Similarly, land prices in Al Wakra have been stable in the past years due to major infrastructural projects.”
From the IMF’s latest report on Qatar:
“After a period of rapid growth, real estate prices in Qatar are adjusting to new levels. According to the real estate price index developed by QCB, following an 82 percent increase during 2012–16, real estate prices fell by 15 percent during 2017–18. Data produced by the Ministry of Justice indicate the following trends:
- Both the volume and number of transactions are down since 2013–2014 peak.
Posted by at 10:51 AM
Labels: Global Housing Watch
Friday, May 31, 2019
The radical plan to change how Harvard teaches economics
From Vox:
“If Harvard has a most famous course, it’s Economics 10.
The introductory economics class is reliablyone of the most popular courses offered to undergraduates. It’s usually taught in a massive Hogwartsian auditorium, where hundreds of students either dutifully take notes or mess around on laptops as one of the school’s star economists leads them through the basics of supply and demand.
Because Harvard has a tendency to set the pattern for other universities, Ec 10’s textbook is a massive best-seller, used at dozens of other schools, earning its author, professor Greg Mankiw, an estimated $42 million in royalties since it was first released in 1998. Mankiw’s introduction to economics has set the tone not just at Harvard but for how Econ 101 is taught across the country.
Mankiw’s textbook covers the abstract theory that underpins economics as it has been understood for decades. It is about supply and demand, about how prices can be used to match production of a good to its consumption, and about the power of markets as a tool for allocating scarce resources. Students in Ec 10 are asked to plot supply and demand curves, to solve simple word problems about what happens when the mayor of Smalltown, USA, imposes a tax on hotel rooms.
The idea is to impart a basic theory, to lay a foundation for understanding how society works. And that theory strongly implies that markets tend to work without much intervention, and that things like minimum wages might hurt more than help.
But another Harvard economist has a different idea of how to introduce students to economics.
Raj Chetty, a prominent faculty member whom Harvard recently poached back from Stanford, this spring unveiled “Economics 1152: Using Big Data to Solve Economic and Social Problems.” Taught with the help of lecturer Greg Bruich, the class garnered 375 students, including 363 undergrads, in its first term. That’s still behind the 461 in Ec 10 — but not by much.”
Continue reading here.
Raj Chetty, professor of economics at Harvard University, poses for a portrait at the Opportunity Insights offices. (Kayana Szymczak for Vox)

From Vox:
“If Harvard has a most famous course, it’s Economics 10.
The introductory economics class is reliablyone of the most popular courses offered to undergraduates. It’s usually taught in a massive Hogwartsian auditorium, where hundreds of students either dutifully take notes or mess around on laptops as one of the school’s star economists leads them through the basics of supply and demand.
Because Harvard has a tendency to set the pattern for other universities,
Posted by at 4:05 PM
Labels: Profiles of Economists
Subscribe to: Posts