


Tuesday, November 27, 2018
Understanding Behaviour of Home Buyers Across Countries
Global Housing Watch Newsletter: November 2018
* Using ING’s International Survey, Ian Bright—Group Research Managing Director at ING and Jessica Exton—Behavioural Scientist at ING, discuss international attitudes towards homes and mortgages. The ING International Survey is one of the largest and longest-running surveys of its type in Europe.
The survey
Hites Ahir: ING has been conducting a regular annual survey called—ING International Survey of Homes and Mortgages since 2013. Could you tell us a bit about this survey?
Ian Bright and Jessica Exton: The ING International Survey on homes and mortgages is one of three surveys carried out each year to better understand how people around the globe spend, save, invest and feel about money. The other two surveys cover consumer attitudes to saving and investment, and mobile banking and new technology. ING’s International Consumer Economics team, embedded in ING’s Group Research department in London, works with 13 of ING’s retail business units across Europe, as well as the United States and Australia, to deliver these surveys. Around 1,000 people in 15 countries (500 in Luxembourg) are surveyed online by Ipsos, giving a sample of about 15,000.
Hites Ahir: What are the main messages coming out from this year’s reports released in September and October?
Ian Bright and Jessica Exton: This year’s homes and mortgages survey was split into two reports. The September report noted the increasing unaffordability of housing for many people. Affordability challenges contribute to the 35 percent of non-owners in Europe who say they don’t ever expect to buy a house. Discussion about housing often focuses on local or national elements. Yet the perception that housing is expensive in many countries suggests global factors play a role too. Many told us they consider the housing market in their country to be on the wrong track. The October report focused on consumer attitudes to the environmental aspects of housing. Once again affordability is the biggest challenge preventing people from doing more to reduce the environmental impact of living in their homes.
“House prices never fall”
Hites Ahir: “Many continue to feel that house prices never fall”—this is a quote from the findings of this year’s survey of September. Here is another quote from the 2017 survey: “A third still believe that house prices never fall”. And here is one more quote from the 2016 survey: “People still believe that house prices never fall”. What could explain this view in markets that have recently experienced a bust?
Ian Bright and Jessica Exton: This is one of the most disturbing results from our survey: a result that we have found again and again each year. We first asked consumers how much they agree or disagree with this question in 2014 and have asked it every year since. Originally we thought this was a throwaway line that would be wholeheartedly rejected. We have been proved wrong repeatedly.
When presented with the statement “house prices never fall” about 40 percent of respondents across the 13 European countries consistently “agree” or “strongly agree”.
The responses vary between countries but seem to increase if house prices rose in the immediate past. Consumers don’t appear to take long-run trends into account.
One explanation for this may be that myopia takes hold fairly quickly once prices start rising from a trough. We may expect trends to continue given the salience of recent events. This myopia may extend beyond a time element and have a neighbourhood element as well. If house prices in your immediate area did not fall while prices elsewhere did, you may feel immune from national or wider economic effects.
Another explanation for this may be how people interpret the term ‘never’. Defined strictly, “never” means no chance of occurring. However, many consumers may interpret “never” as simply meaning “very unlikely”.
For example, in the Netherlands, agreement virtually tripled from 11 percent in 2014 to 30 percent in 2016 (Figure 1). This was despite persistent price falls in the five immediately preceding years and with the national house price index at the start of 2016 still 14 percent below the mid-2008 peak.
Figure 1.
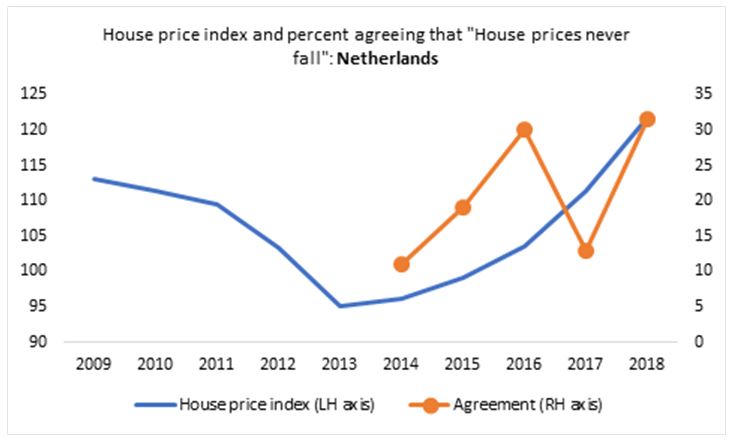
We see this V-shape between 2016 and 2018 because people were given slightly different answer options in different surveys. But the trends remain consistent. For the first three years, respondents could either agree, disagree or choose “do not know”. In 2017, we replaced “do not know” with “neither agree or disagree”, and in 2018 we included both of these options. Responses have jumped back up to similar levels this year.
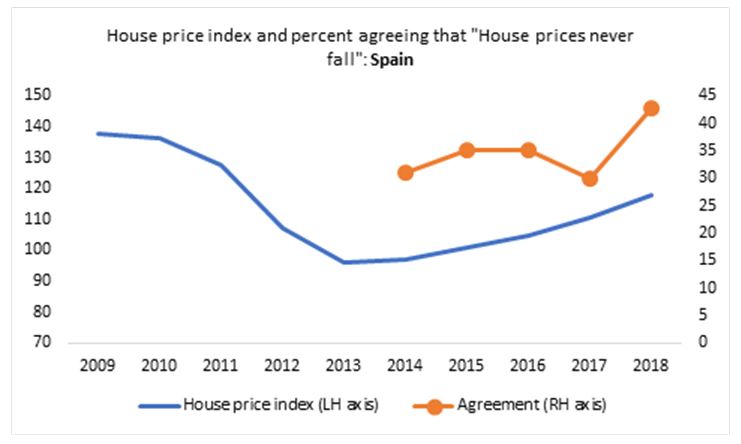
We see a similar pattern in the United States and Spain (Figure 2 and 3).
Figure 2.
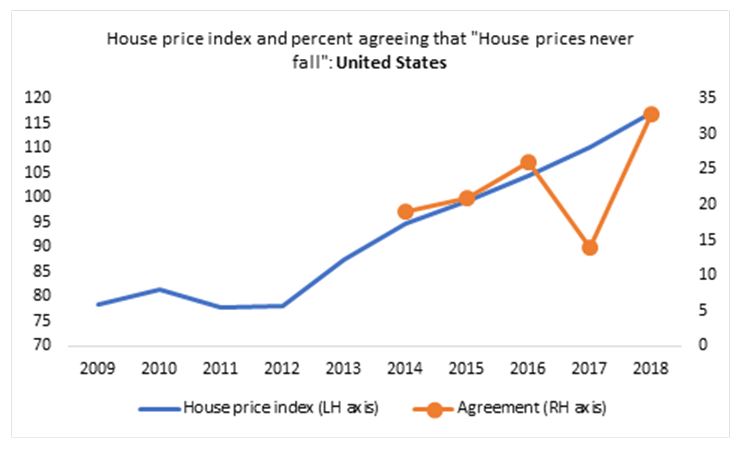
Figure 3.
Hites Ahir: What is the implication of the expectation that prices will continue to rise?
Ian Bright and Jessica Exton: The evidence suggests many underestimate the risks associated with buying a house: prices can go down as well as up, for example. And it’s not just price risk that is relevant. Other risks people might fail to take into account when making a purchase decision include changes in interest rates that will impact loan repayments, the high opportunity cost of tying equity into a home and additional costs associated with home ownership such as repairs and insurance.
This suggests people need a clear understanding of not only the risks associated with taking out a mortgage but also with the broader experience of home ownership. Financial institutions have a role to play here.
However, this may be a challenge. There is evidence that people don’t trust banks in some contexts while at the same time our surveys continually find that people on average are open to assistance from their specific bank. In other words, ‘banks’ in general may not be trusted but ‘my bank’ may have a higher level of trust.
As an illustration, our 2014 survey found that two in three respondents across 13 European countries agreed with the statement: “Banks are not interested in the financial welfare of their customers, they just want to sell the biggest mortgage possible.”
However, the same 2014 survey found that when trouble strikes and a person can no longer pay their mortgage, they expect their bank to help. Thirty-six percent believed the best approach would be for the lender to offer more time to pay and 23 percent that a repayment holiday should be made available.
In the same survey 73 percent agreed that the primary responsibility for financial decisions lay with them but just 35 percent agreed deciding the right mortgage value was their responsibility. 41 percent agreed that this was the responsibility of both themselves and their bank.
Hites Ahir: Bob Shiller has argued that when looking at the aggregate level and over the long term, housing has not been a great place to invest money. Yet your latest survey finds that “71 percent still agree it’s better to own a property”. How do you reconcile these two different views?
Ian Bright and Jessica Exton: Regardless of what academics and studies report, we find high shares across Europe believe that buying a home is better financially than renting. In our 2017 ‘Renting vs Owning’ report, 68 percent of respondents living in Europe agreed with the statement “buying is a smart money decision”. Just 8 percent said the same about renting. Sixty-six percent, the same year, said “everyone would buy if they could afford to”. Based on these responses, people don’t appear to anticipate monetary loss through property ownership.
What’s more, buying a house is not purely a financial decision. Housing is an aspirational good. Asked in the 2017 survey to think about symbols of success when it comes to housing, 65 percent across Europe identified buying compared with only four percent for renting. Only 23 percent answered neither. In the same survey 60 percent of those renting would prefer to own. For owners, only 11 percent would like to rent.
Evidence from our surveys suggest elements of bubble mentality continue to affect people’s perceptions of housing.
Over several years, respondents have been asked whether they believe houses where they live are expensive or cheap. They have also been asked separately whether they expect house prices to rise or fall in the next 12 months.
Figure 4.
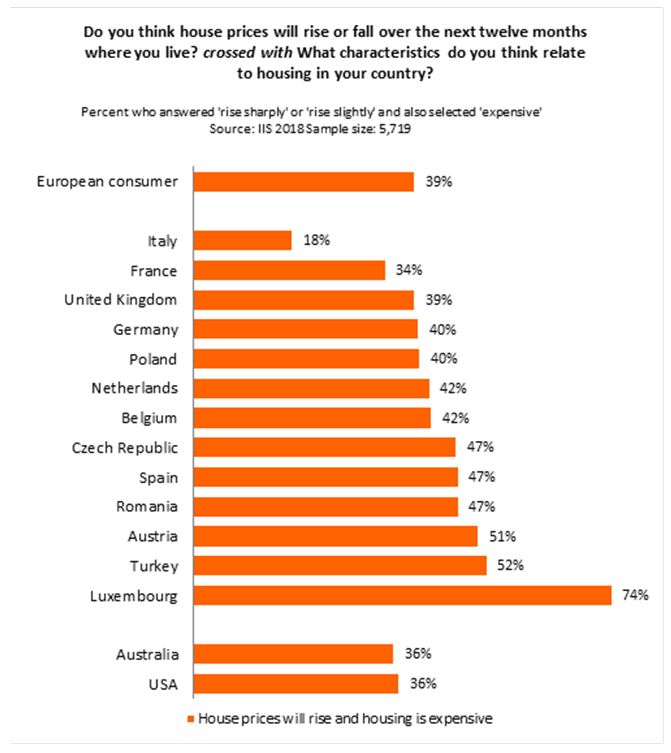
A majority in Europe consider houses where they live to be expensive. However 39 percent of these people also expect house prices to rise in the next 12 months (Figure 4). By implication, they believe houses will become even more expensive. It may be rational to think that expensive products will become more costly over time. But another explanation may be a persistent shortage of supply compared with demand, which is consistent with dysfunctional housing markets.
People may feel caught in a trap, considering houses to be expensive but with no other option but to buy given they believe house prices are going to rise even further.
The evidence points to strong price momentum in housing. And as we suggested before, it may also reflect the persistence of bubble psychology if we follow Shiller’s definition of a bubble.[1]
On affordability and the state of the housing market…
Hites Ahir: How does the finding that “house prices never fall” change if you group the responses by boom, post boom, and markets where house prices have been stable?
Ian Bright and Jessica Exton: We have not been able to consistently group countries and their agreement to this statement based on boom and post-boom markets. Post boom effects are felt differently across countries. For example, Spain has seen a volatile housing market over the past decade yet between 2014 and 2018, agreement with the statement that “house prices never fall”, did not fall below 30 percent; it was 43 percent in the latest survey (2018).
Conversely, in Australia, where house prices have been booming until this year, agreement was stable from 2015 to 2018, at between 28 to 33 percent. One thing that was surprising in the latest survey was the high percentage of people who not only agreed with the statement but chose “strongly agree”. Across Europe as a whole, 19 percent strongly agreed, and the share was highest in Luxembourg at 39 percent and Turkey at 35 percent.
Hites Ahir: Let’s turn to the survey’s findings related to housing affordability. One of the questions in the survey is: what is the main reason you don’t expect to be able to buy a property? What do you find for boom, post boom, and stable markets?
Ian Bright and Jessica Exton: Of those who have never owned a property, 35 percent across Europe don’t expect to be able to buy. The main reason given by 56 percent was insufficient income but 19 percent replied prices will remain too high and 16 percent indicated a lack of long term job security. That said there was noticeable differences between some countries.
Countries where national house prices have been increasing rapidly, such as Luxembourg and the United Kingdom were more inclined to respond that price were too high, with 54 percent and 31 percent giving this as their main reason. In Luxembourg, it was the most common response and insufficient income was mentioned by fewer than half in both these countries.
A concern that prices would stay too high, was the second most cited response after insufficient income, for ten of the 15 countries surveyed.
Italy, where housing could be considered in a post boom period, stood out with 40 percent noting a lack of long term job security as the main reason.
Hites Ahir: At what age are people buying their first property?
Ian Bright and Jessica Exton: The 2018 survey showed the age at which people buy their first home varies noticeably between countries. Across Europe in general 60 percent of those who currently own bought before the age of 30, but this varies from a low of 46 percent in Germany to highs of 76 percent in the United Kingdom, 71 percent in Spain and 70 percent in the Netherlands. The figures for Australia and the United States are towards the upper end of the European distribution at 72 percent and 67 percent.
However, there is evidence younger people expect to buy their first home at an older age in future. Across Europe, of those aged 18 to 24 who do not own a property, only 34 percent expect to buy by the time they are 30. Only 39 percent of young Australians and 42 percent of Americans expect to buy before 30.
This indication of increasing difficulty in buying a property fits with responses from the 2018 survey which found 72 percent across Europe (64 percent in the United States and 78 percent in Australia) agree with the statement “For newcomers to the housing market, it is increasingly difficult to buy a house.” Similar results were seen when we asked this question in 2015. Arguably this opinion contributed to responses in 2015 that found 72 percent across Europe agreed with the statement “It would be good for society if house prices fell”. Renters at 78 percent were more likely to agree but 69 percent of home owners also agreed.
Hites Ahir: What do people think about the housing situation in their country?
Ian Bright and Jessica Exton: More than half (53 percent) across Europe consider housing in their country to be on the wrong track, according to the 2018 survey. That was up from 45 percent in 2017. In none of the 15 countries surveyed in either 2017 or 2018 does a majority consider housing to be on the right track. This year discontent was expressed most in Turkey with 69 percent considering housing to be on the wrong track, closely followed by Spain at 68 percent. Housing was most likely to be considered to be on the right track in Poland at 39 percent and the United States at 36 percent.
People were left to interpret right and wrong track for themselves. However, responses from this and previous surveys suggest continued high house prices and increasing difficulty for younger generations to buy a property are contributors to this dissatisfaction.
[1] Bubbles are hard to define. But in his 2014 Nobel speech Robert Shiller discussed the nature of asset price bubbles and noted a definition that represented the term’s best use, which he outlined in the second edition of his book Irrational Exuberance: “A situation in which news of price increases spurs investor enthusiasm which spreads by psychological contagion from person to person, in the process amplifying stories that might justify the price increase and bringing in a larger and larger class of investors, who, despite doubts about the real value of the investment, are drawn to it partly through envy of others’ successes and partly through a gambler’s excitement.”
Global Housing Watch Newsletter: November 2018
* Using ING’s International Survey, Ian Bright—Group Research Managing Director at ING and Jessica Exton—Behavioural Scientist at ING, discuss international attitudes towards homes and mortgages. The ING International Survey is one of the largest and longest-running surveys of its type in Europe.
The survey
Hites Ahir: ING has been conducting a regular annual survey called—ING International Survey of Homes and Mortgages since 2013.
Posted by at 5:00 AM
Labels: Global Housing Watch
Sunday, November 25, 2018
Grim Stock Signals Piling Up as Wall Street Mulls Recession Odds
A new Bloomberg post cites my study:
“Nine turbulent weeks and a correction in U.S. stocks have left analysts with a thorny question. What’s the market saying about the economy? And while few see incontrovertible signs investors are bracing for a recession, it’s a word that’s been coming up more as they seek a signal in the chaos.
From the ascent of defensive industries to the sudden craze for companies that resist volatility, stocks are acting in ways that have presaged slowing growth in the past. That makes sense: gains in the economy and corporate earnings are forecast to ease in 2019 from this year’s torrid pace.
Befitting that, most of the charts that follow reflect observations by analysts who don’t see a recession as the most obvious conclusion. Many view the sell-off as healthy after a 10-year run of gains. But with a trade war flaring and the Federal Reserve set to boost interest rates again, the number of stock researchers who are at least willing to mention the possibility is rising.”
“Economists haven’t always done a great job predicting contractions. A 2014 study by the International Monetary Fund’s Prakash Loungani found that not one of 49 recessions suffered around the world in 2009 had been predicted by the consensus of economists a year earlier. Loungani previously reported that only two of the 60 recessions of the 1990s had been anticipated a year in advance.”
“[…] the economic indicators that often precede recession — yield curve inversion and rising unemployment — are not flashing warning signs. The yield curve is flat but not inverted and the unemployment rate keeps falling, as opposed to rising when a recession approaches.”
A new Bloomberg post cites my study:
“Nine turbulent weeks and a correction in U.S. stocks have left analysts with a thorny question. What’s the market saying about the economy? And while few see incontrovertible signs investors are bracing for a recession, it’s a word that’s been coming up more as they seek a signal in the chaos.
From the ascent of defensive industries to the sudden craze for companies that resist volatility,
Posted by at 1:19 PM
Labels: Forecasting Forum
A New Canadian Macroeconomic Database
From a new post by Dave Giles:
“Anyone who’s undertaken empirical macroeconomic research relating to Canada will know that there are some serious data challenges that have to be surmounted.
In particular, getting access to long-term, continuous, time series isn’t as easy as you might expect.
Statistics Canada has been criticized frequently over the years by researchers who find that crucial economic series are suddenly “discontinued”, or are re-defined in ways that make it extremely difficult to splice the pieces together into one meaningful time-series.
In recognition of these issues, a number of efforts have been made to provide Canadian economic data in forms that researchers need. These include, for instance, Boivin et al. (2010), Bedock and Stevanovic (2107), and Stephen Gordon’s on-going “Project Link“.
Thanks to Olivier Fortin-Gagnon, Maxime Leroux, Dalibor Stevanovic, &and Stéphane Suprenant we now have an impressive addition to the available long-term Canadian time-series data. Their 2018 working paper, “A Large Canadian Database for Macroeconomic Analysis“, discusses their new database and illustrates its usefulness in a variety of ways.”
From a new post by Dave Giles:
“Anyone who’s undertaken empirical macroeconomic research relating to Canada will know that there are some serious data challenges that have to be surmounted.
In particular, getting access to long-term, continuous, time series isn’t as easy as you might expect.
Statistics Canada has been criticized frequently over the years by researchers who find that crucial economic series are suddenly “discontinued”,
Posted by at 1:08 PM
Labels: Macro Demystified
How does monetary policy affect income and wealth inequality?
From a new paper by Yannis Dafermos and Christos Papatheodorou:
“The recent empirical literature on the distributional effects of monetary policy on inequality has focused on the various channels through which a change in the policy interest rate or the central bank asset purchases affect income and wealth inequality. Although most studies show that expansionary (contractionary) conventional policy tends to reduce (increase) income inequality (see Coibion et al., 2017; Mumtaz and Theophilopoulou, 2017; Furceri et al., 2018; Guerello, 2018; Ampudia et al., 2018), there is no consensus on whether these effects are economically significant. In addition, there is no consensus about (i) the size and the direction of the effects of conventional monetary policy on wealth inequality and (ii) the distributional impact of quantitative easing (see e.g. Saiki and Frost, 2014; Domaski et al., 2016; Montecino and Epstein, 2017; Mumtaz and Thephilopoulou, 2017; O’Farrell and Rawdanowicz, 2016; Ampudia et al., 2018; Casiraghi et al., 2018; Guerello, 2018; Koedijk, 2018). This comes as no surprise: the magnitude of the distribution channels of monetary policy depends on a number of factors which influence the impact of these channels across countries and time periods. For example, it has been shown that the effect of monetary policy on inequality depends on the initial wealth distribution and the composition of household financial assets (O’Farrell and Rawdanowicz, 2017; Guerello, 2018), the initial wage share (Furceri et al., 2018) and the marginal propensity to consume (Ampudia et al., 2018).
Despite these recent developments in the empirical literature, there is currently no theoretical model that incorporates the key distribution channels of monetary policy simultaneously and is capable of analysing in a systematic way the exact conditions under which monetary policy has economically significant effects on inequality. This paper develops such a model by combining the agent-based (AB) and the stock-flow consistent (SFC) approaches to macroeconomic modelling. The SFC approach is characterised by the explicit incorporation of accounting principles into dynamic macro modelling and the emphasis that it places on the dynamic interplay between monetary stocks and flows (see Godley and Lavoie, 2007a). The AB approach is suitable for exploring how macroeconomic phenomena emerge out of the interactions between heterogeneous agents. It has been recently argued that the combination of agent-based and stockflow consistent approaches is a fruitful avenue for the reconstruction of macroeconomics, moving beyond the conventional representative agents framework (see e.g. van der Hoog and Dawid, 2015; Caiani et al., 2016).”
From a new paper by Yannis Dafermos and Christos Papatheodorou:
“The recent empirical literature on the distributional effects of monetary policy on inequality has focused on the various channels through which a change in the policy interest rate or the central bank asset purchases affect income and wealth inequality. Although most studies show that expansionary (contractionary) conventional policy tends to reduce (increase) income inequality (see Coibion et al., 2017; Mumtaz and Theophilopoulou,
Posted by at 1:04 PM
Labels: Inclusive Growth
Personal Income Tax Progressivity: Trends and Implications
From a new IMF working paper:
“This paper has approached progressivity from different angles. Bringing together our findings, we can conclude strongly that progressivity has decreased over the last few decades, a finding that is robust to the choice of measure. We also conclude, but with less certainty, that the reduction in progressivity appears not to have given growth a boost.
While this paper focused on personal income taxes, developments in capital income taxation are also likely to have contributed to reducing overall progressivity: Capital income is distributed more unequally than labor income, has risen over the past few decades as a share of total income (IMF, 2017b), and is often taxed at a lower rate than labor income. The corporate income tax, in particular, plays an important role in determining progressivity. First, there can be a direct effect to the extent that it is partly borne by owners of corporations. Second, it indirectly supports the enforcement of the taxation of labor income: Corporate taxation mitigates arbitrage in response to taxation of entrepreneurial income, because distinguishing labor income from capital income can be difficult (or impossible) when individuals can freely choose the form through which they declare their income (IMF, 2014). When the personal income tax base can be shifted to some alternative tax base that is taxed at a lower rate (such as corporate income), optimal tax theory implies that the optimal tax rate on personal income rises with the tax rate on the alternative base. In recent decades, international tax competition—resulting from capital mobility—has led to a steady downward trend in corporate income tax rates (Table 2). This trend reduces overall tax progressivity and may also put downward pressure on personal income tax rates—even though labor itself is less mobile and could be taxed more easily in a globalized world.
There are many unresolved questions and areas for further research. For example, progressivity measures taking the entire tax and benefit system, and ideally even public spending, into account would enhance the understanding of overall progressivity tremendously. The challenges in finding such a measure, especially one that is still independent of pre-tax and spending distributions are enormous.
Despite the absence of a fully comprehensive measure of progressivity, and some reasonable doubts about the impact of progressivity on growth, it appears safe to say that progressivity-enhancing measures could be taken without major risks to growth. This would be especially relevant in countries that are marked by great inequality.”
From a new IMF working paper:
“This paper has approached progressivity from different angles. Bringing together our findings, we can conclude strongly that progressivity has decreased over the last few decades, a finding that is robust to the choice of measure. We also conclude, but with less certainty, that the reduction in progressivity appears not to have given growth a boost.
While this paper focused on personal income taxes,
Posted by at 12:57 PM
Labels: Inclusive Growth
Subscribe to: Posts