Showing posts with label Global Housing Watch. Show all posts
Friday, February 28, 2020
House Prices in Malaysia
From the IMF’s latest report on Malaysia:
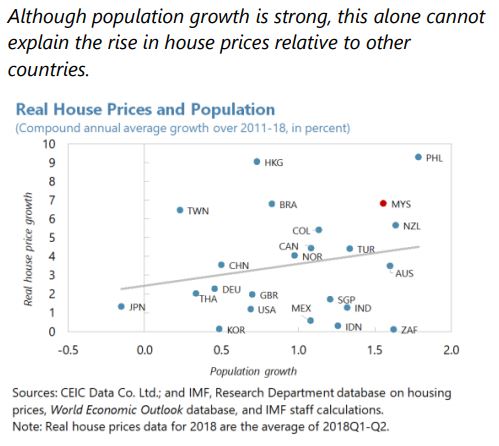
“Over the past decade, real house prices rose faster than income. House prices in Malaysia increased faster than in many regional comparators in the wake of the GFC (text chart). On average real house prices rose by 6 percent in Malaysia annually since 2010, compared with below one percent in regional comparators. At the same time, per capita income in Malaysia grew by around 4 percent annually leading to a deterioration in affordability over this time period (text chart).
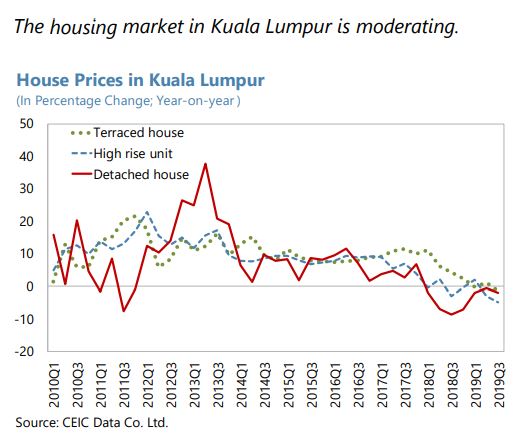
From 2015 onwards, house price growth has moderated from high levels. The average annual nominal house price increase during 2010-14 was 10 percent, but it has declined to an average of 5.5 percent during 2015-19. Most recently, preliminary data indicate that house prices increased by 0.4 percent in 2019Q3 (year-on-year) (text chart). The moderation in house price growth is broad-based across regions, including Kuala Lumpur (text chart).
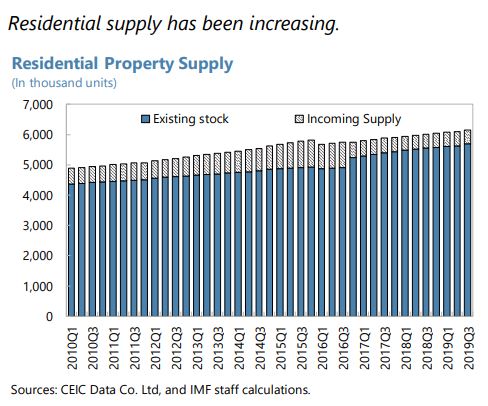
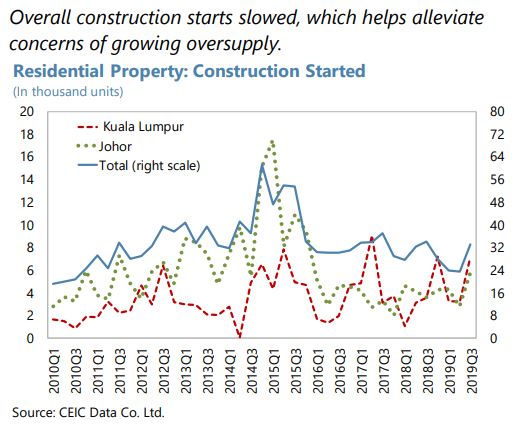
Residential housing supply has responded to higher prices with a lag. Supply factors are important determinants of housing market dynamics, especially considering that residential housing has long planning-to-production lags which can produce temporary supply and demand mismatches. In the aftermath of the GFC, residential property launches plummeted from a peak of nearly 350,000 units before the GFC to a lowest point of 173,000 in 2012 (text chart). The increase in house prices during 2010-15 triggered a strong supply response from 2015 onwards and currently housing starts are well above 300,000.
The strong supply response has led to overproduction in some segments of the market. Affordable housing in Malaysia is usually considered to be below RM300,000.2 Unsold properties in the upper segment (above RM500,000) has increased sharply in 2018-19, particularly in the high-rise apartment segments, whereas recent housing demand has been strong in the lower segments of the market as evidenced by the lower inventory of unsold housing units; unsold units above RM 1 million remain at a high level.
In contrast, there is an undersupply of housing at affordable levels, especially in urban areas. The deterioration of housing affordability can be illustrated in the house price-to-income ratio, which has increased from 4.1 in 2002 to 5.0 in 2016 (see Khazanah Research Institute, 2019). In addition, urban migration has increased housing demand in urban areas. The World Bank (2019) finds that households in Kuala Lumpur and Petaling District with monthly incomes below RM5,000 experience severe unaffordability, and can experience difficulty finding finance given low and often volatile income. Households with incomes from RM6,000-10,000 have moderate difficulty in purchasing a home, while those with incomes above RM10,000 find ample supply within their capacity-to-pay.
House prices are estimated to be moderately overvalued. Using an econometric model with fundamental determinants of house prices such as affordability, per capita income, interest rates, credit growth, working age population and equity share prices, suggest that real house prices remain about 15 percent above what fundamental macroeconomic variables would indicate (Box 1), although the overvaluation has slightly narrowed in recent years as house price increases have moderated.
Along with the increase in house prices, household debt has risen sharply over the past decade. Household debt increased from 60.4 percent of GDP in 2008 to 86.5 percent in 2016. Household debt has stabilized around 82 percent in 2019. Nevertheless, the level of household debt in Malaysia is relatively high by regional standards. Of the total household debt, around 54.5 percent is residential mortgages in 2019. Household debt by monthly income (as a share of total) has decreased for households making less than RM3,000, from 22.8 to 18.5 percent perhaps partly as a result of loan affordability assessments following the introduction of BNM’s Responsible Financing Guidelines in 2012.
High household debt raises financial stability risks, although households also hold substantial assets and non-performing loans are low. Although growth in household debt has moderated in recent years, some households could face increasing stress, particularly if they are over-extended from easier lending conditions in the past and severe income shocks could erode household financial buffers and impact spending (see Nordin et al 2018). Financial stability concerns relating to household debt are cushioned by high household assets (more than twice the debt) of which 2/3 are considered liquid. Moreover, household non-performing loans have declined and are somewhat below the banking sector average of 1.6 percent of total lending.
The concept of “House price at Risk” (HaR) can be used to obtain a measure of worst possible outcome for house prices over a given horizon. Following the approach in IMF (2019), a housing-at-risk approach quantifies the risk of negative house price growth 4-quarters ahead. Specifically, we use the explanatory variables in the econometric model discussed in the appendix to derive a distribution of projected real house price increases four quarters ahead. Using this approach suggests that the mode of house price increase will stabilize around 1.5 percent four quarters ahead (see text chart).”
Continue reading here.


From the IMF’s latest report on Malaysia:
“Over the past decade, real house prices rose faster than income. House prices in Malaysia increased faster than in many regional comparators in the wake of the GFC (text chart). On average real house prices rose by 6 percent in Malaysia annually since 2010, compared with below one percent in regional comparators. At the same time, per capita income in Malaysia grew by around 4 percent annually leading to a deterioration in affordability over this time period (text chart).
Posted by at 5:10 PM
Labels: Global Housing Watch
Foreign Demand and Local House Prices: Evidence from the US
A new IMF working paper by Damien Puy, Anil Ari, and Yu Shi:
“We test whether foreign demand matters for local house prices in the US using an identification strategy based on the existence of “home bias abroad” in international real estate markets. Following an extreme political crisis event abroad, a proxy for a strong and exogenous shift in foreign demand, we show that house prices rise disproportionately more in neighbourhoods with a high concentration of population originating from the crisis country. This effect is strong, persistent, and robust to the exclusion of major cities. We also show that areas that were already expensive in the late 1990s have experienced the strongest foreign demand shocks and the biggest drop in affordability between 2000 and 2017. Our findings suggest a non-trivial causal effect of foreign demand shocks on local house prices over the last 20 years, especially in neighbourhoods that were already rather unaffordable for the median household.”
A new IMF working paper by Damien Puy, Anil Ari, and Yu Shi:
“We test whether foreign demand matters for local house prices in the US using an identification strategy based on the existence of “home bias abroad” in international real estate markets. Following an extreme political crisis event abroad, a proxy for a strong and exogenous shift in foreign demand, we show that house prices rise disproportionately more in neighbourhoods with a high concentration of population originating from the crisis country.
Posted by at 5:04 PM
Labels: Global Housing Watch
Household Debt and House Prices-at-risk: A Tale of Two Countries
From a new IMF working paper by Adrian Alter and Elizabeth M. Mahoney:
“To identify and quantify downside risks to housing markets, we apply the house price-at-risk methodology to a sample of 37 cities across the United States and Canada using quarterly data from 1983 to 2018. This paper finds that downside risks to housing markets in the United States have seemingly fallen over the past decade, while having increased in Canada. Supply-side drivers, valuation, household debt, and financial conditions jointly play a key role in forecasting house price risks. In addition, capital flows are found to be significantly associated with future downside risks to major housing markets, but the net effect depends on the type of flows and varies across cities and forecast horizons. Using micro-level data, we identify households vulnerable to potential housing shocks and assess the riskiness of household debt.”
From a new IMF working paper by Adrian Alter and Elizabeth M. Mahoney:
“To identify and quantify downside risks to housing markets, we apply the house price-at-risk methodology to a sample of 37 cities across the United States and Canada using quarterly data from 1983 to 2018. This paper finds that downside risks to housing markets in the United States have seemingly fallen over the past decade, while having increased in Canada.
Posted by at 3:44 PM
Labels: Global Housing Watch
Housing View – February 28, 2020
On the US:
- ‘A Mask for Racial Discrimination.’ How Housing Voucher Programs Can Hurt the Low-Income Families They’re Designed to Help – Time
- Why Does It Cost $750,000 to Build Affordable Housing in San Francisco? – New York Times
- The Airbnb Effect On Housing And Rent – Forbes
- US housing finance is stuck in a complex knot of contradictions – Financial Times
- Housing regulations are getting in the way of fighting homelessness – Washington Post
- The declining elasticity of US housing supply – VOX
- Joe Biden wants tougher standards for real-estate appraisers to help black and Latinx homeowners – MarketWatch
- Special briefing on walkability – American Enterprise Institute
- Does Joe Biden Have a Plan to Stop Gentrification? – Citylab
On other countries:
- [China] History and Outlook of China’s Housing Market – SpringerLink
- [Netherlands] Dutch house price boom continues – Global Property Guide
- [New Zealand] New Zealand’s housing market bounced back strongly – Global Property Guide
- [United Kingdom] Housing insecurity, homelessness, and populism: Evidence from the UK – VOX
On the US:
- ‘A Mask for Racial Discrimination.’ How Housing Voucher Programs Can Hurt the Low-Income Families They’re Designed to Help – Time
- Why Does It Cost $750,000 to Build Affordable Housing in San Francisco? – New York Times
- The Airbnb Effect On Housing And Rent – Forbes
- US housing finance is stuck in a complex knot of contradictions – Financial Times
- Housing regulations are getting in the way of fighting homelessness – Washington Post
- The declining elasticity of US housing supply – VOX
- Joe Biden wants tougher standards for real-estate appraisers to help black and Latinx homeowners – MarketWatch
- Special briefing on walkability – American Enterprise Institute
- Does Joe Biden Have a Plan to Stop Gentrification?
Posted by at 5:00 AM
Labels: Global Housing Watch
Tuesday, February 25, 2020
How Affordable is Housing? Insights from a New Data Set
Global Housing Watch Newsletter: February 2020
A remarkable new data set constructed by Jean-Charles Bricongne, Alessandro Turrini and Peter Pontuch allows direct comparison of house prices across countries—illustrating big differences in how many years of income it takes to buy a house—and provides suggestive evidence of when house prices may be at risk of correction. Prakash Loungani summarizes the data set and poses a few queries to its creators.
How expensive on average are houses in the United States relative to Australia? And how many years of income would it take the average person to buy the average house in each country?
It would seem that the answers to these questions should not be too difficult to provide. After all there are a number of data sets that give cross-country data on house prices in various countries. But most of the data sets provide price indices, not the actual price of houses. They can be used to compare appreciation in house prices across countries over some time period, but don’t necessarily tell us whether houses in the United States are more affordable than in Australia and how the relative affordability has changed over time.
Figure 1: House price per square meter in 2016 (in euros)
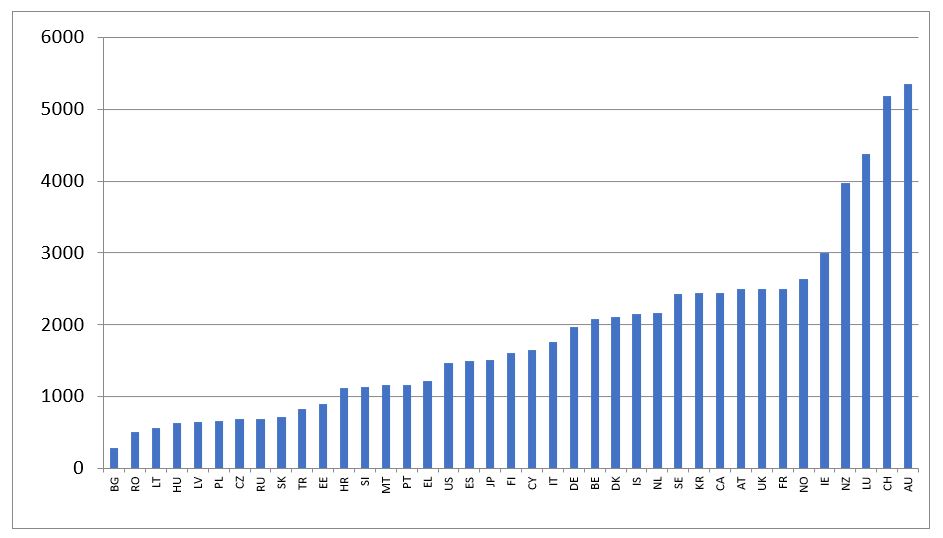
A new data set called HouseLev put together by Jean-Charles Bricongne, Alessandro Turrini and Peter Pontuch fills the gap. It provides the average price per square meter of housing in 40 countries, from as far back in 1970 for most countries to the most recent available, generally 2017 or 2018.
The authors use two methods, top-down and bottom-up, with the latter intended to provide a check on the former or a back-up estimate when the top down method is not feasible due to missing data.
The top-down method computes the average price as the ratio of the total value of dwellings and associated land to the total floor area of dwellings. The total value of dwellings and land (‘the numerator’) is generally taken from the national income accounts of countries; the total floor area (‘the denominator’) is from the census data of countries. Divide one by the other and, presto, you have the average price of a house.
So now we have an answer to the first question posed earlier. As shown in Figure 1, it turns out that the cost of the average house price in the United States is under 1500 euros per square meter and over 5000 euros per square meter in Australia. (For metrically-challenged U.S.-centric readers, that’s about $150 per square foot in the United States.)
Of the countries in the data set, houses in Bulgaria are the cheapest at under 300 euros per square meter and the most expensive houses are in Hong Kong (SAR)—prices there are literally off the charts—nearly 30,000 euros per square meter!—and hence not shown in Figure 1.
How reliable are these estimates? Here’s where the bottom-up approach comes in. The authors have painstakingly gone through the websites of real estate agents and collected the data on sales offers in different locations. These data are then aggregated up to give a country-level average. Reassuringly, for most countries, the top-down approach and the bottom-up approach give similar estimates of house prices—the median difference in only 7 percent and the biggest difference is 12 percent.
Figure 2: Years of income required to purchase a house in 2016
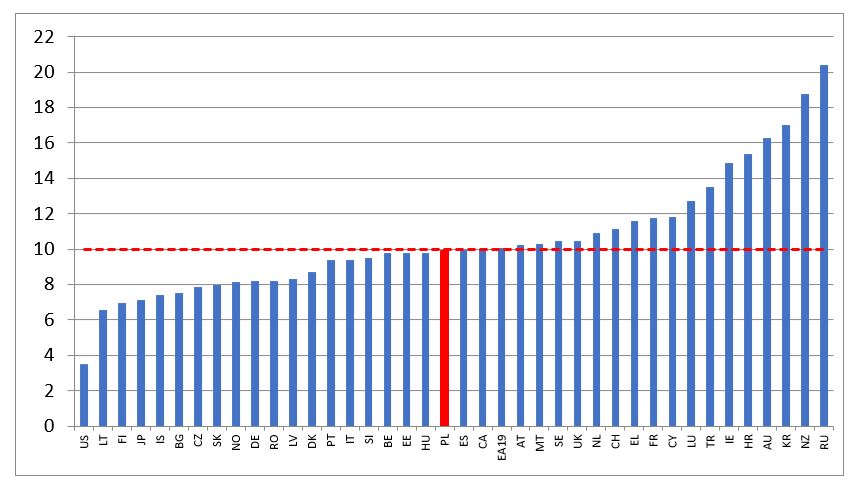
Figure 2 shows that it takes under 4 years of average income to buy a house of average size in the United States and over 16 years in Australia. The median across countries is 10 years.
The creators of the data set also looked into whether high ratios of house prices to incomes can signal a correction in house prices. They find that if the ratio is greater than 10, there is concrete risk of a significant downward correction of house prices in the following three years (see their paper, Bricongne et al. (2019), for the details).
Q&A with the creators:
Q. Is the data set publicly available?
A. The data set that covers forty countries is publicly available with detailed annexes of prices in levels in national currencies, in euros, in PPP (purchasing power parity) and with price to income ratios, in the annex of the European Commission Discussion Paper available at the following link: https://ec.europa.eu/info/sites/info/files/economy-finance/dp101_en_houselev.pdf
Q. You mentioned plans to extend the dataset to the regional level? What is the status of this work?
A. Work is ongoing in the Commission, with first results covering all EU countries expected for Autumn 2020. The Commission, Banque de France and the OECD are cooperating and interacting on these efforts. Initial raw results are available already at a basic regional level for the EU27 countries (the so-called NUTS2 level), with time series broadly spanning the 2010s.
Since national accountants quite rarely publish data at a local (NUTS3) level, the principal source to produce regional house prices in levels is the one based on web scraping, as well as aggregates from administrative data. The main issues that we encountered with the construction of sub-national price levels is comparability, which is why we focus mainly on improving stratification algorithms and refining our data on housing stocks, incorporating also satellite data.
Q. Will the data set be kept updated on a regular basis? By whom?
A. The dataset will be updated at least annually by the European Commission with Banque de France also contributing to possibly expanding the country coverage. The intent is to give access to the dataset to all potential users. The dataset will initially be accessible at the ‘browsable’ website of the REFINE network (real estate finance and economics network: https://www.institutlouisbachelier.org/en/programme/refine-real-estate-finance-and-economics-network-2/) but other solutions are also being considered.
Q. Has there been any reaction to your estimates (e.g. some validation from country authorities or realtors; anyone challenging your estimates)?
A. HouseLev is a database of estimates: these are not official statistics and they have not been validated neither by national statistical authorities or Eurostat nor by realtors. The estimates have been constructed with the objective of reliability, transparency and comparability, keeping in mind that full comparability is a tremendous challenge for non-homogenous objects such as dwellings. To get estimates as comparable as possible, a common concept of floor area is adopted (“useful floor area”). When possible, comparisons are made on the basis of more than one methodology for computing average prices per square meter.
The data have been shared with EU Member States and used by different institutions: central banks, ministries of finance, academics. A number of comments have been received by experts in the fora where preliminary versions of the dataset have been presented (European Commission, ECB, Banque de France, Paris Dauphine, OECD ACPR—the French Supervisor for banks and insurance companies). On a few occasions, the feedback has helped improving the estimates for some countries or to better qualify the results. Such feedback is being continuously used to incrementally improve the data methodology country by country.
Global Housing Watch Newsletter: February 2020
A remarkable new data set constructed by Jean-Charles Bricongne, Alessandro Turrini and Peter Pontuch allows direct comparison of house prices across countries—illustrating big differences in how many years of income it takes to buy a house—and provides suggestive evidence of when house prices may be at risk of correction. Prakash Loungani summarizes the data set and poses a few queries to its creators.
Posted by at 10:23 AM
Labels: Global Housing Watch
Subscribe to: Posts