Tuesday, June 14, 2022
Some Stock Market Benchmarks
From Conversable Economist:
“When I get the quarterly announcements for what my retirement account is now worth, and a drop in the stock market has caused the total in the account to decline, I find myself looking at some of the long-run patterns in stock market prices.
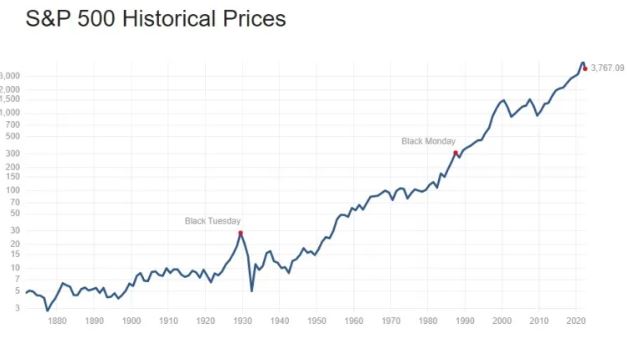
To set the stage, here’s the historical pattern of the S&P stock index since back in the 19th century. In interpreting the figure, notice that the vertical axis is a logarithmic axis showing proportional changes; for example, the tripling from 10 to 30 is the same size as the tripling from 100 to 300 and the same as the tripling from 1000 to 3000. (Without using a log scale, all the smaller values–like the stock market crash of 1929, would just be a little squiggle what would look like a nearly flat line on the far left of the figure.) You can see some of the well-known changes in the stock market over time: the run-up of the 1920s, the crash of 1929, the run-up of the 1960s, the comparatively flat market of the 1970s, a big jump in the dot-com market of the 1990s, the run-up since 2009, and the recent decline. Of course, whenever you consider the possibility that the
For a slightly different view, here is the same set of data, this time adjusted for inflation. Again, the vertical axis shows proportional change. Again, the main well-known changes are pretty visible, but they don’t all look the same. For example, after adjusting for inflation, the Black Tuesday stock market decline in the 1920s looks even more striking, and during the high-inflation 1970s, the real value of the S&P 500 index is falling.
Of course, stock market values should be affected by expectations of corporate earnings. Thus, the standard price-earnings measure of the stock market looks at stock prices divided by corporate earnings over the previous 12 months. Notice that the logarithmic scales have now gone away. Corporate earnings will rise over the long run both because of inflation and along with overall growth in the economy. Thus, one might expect to see the P/E ratio be roughly the same over time, of course with some fluctuations as economic events and market trends interact. Indeed, when you try to find the 1929 stock market crash in this data, it’s barely apparent: after all, if both stock prices and corporate earnings collapse at about the same time, then the ratio of the two may not move in an especially dramatic way.”
Posted by at 8:10 AM
Labels: Macro Demystified
Subscribe to: Posts