Wednesday, April 20, 2022
Figuring out efficient unemployment
From a VoxEU post by Pascal Michaillat and Emmanuel Saez:
“Empirically, the unemployment rate is inversely related to the vacancy rate. Furthermore, servicing a job opening costs about as much as one job in terms of resources. This column shows that the labour market minimises waste when the unemployment rate equals the vacancy rate. It is too slack when the unemployment rate is higher and too tight when it is lower. Consequently, the efficient unemployment rate is simply given by the geometric average of the current unemployment and vacancy rates. At the beginning of 2022, the US labour market is excessively tight, and tighter than at any point since 1951.
Knowing whether an economy is too slack or at risk of overheating is crucial for macroeconomic policy. Economists generally look at price inflation, GDP level relative to potential, and the unemployment rate to assess, this but each measure has issues as can be seen when looking at the current US economy coming out of the Covid-19 crisis.1 An increase in inflation, as experienced in 2021, can be a marker of an overheating economy, but inflation can also increase due to temporary disruptions such as supply chain issues. Assessing whether GDP is below or above potential is challenging as a crisis like Covid-19 also affects the productive potential of the economy. The unemployment rate is 3.6% as of March 2022, not yet lower than just before Covid-19 when the economy did not show signs of overheating.
In this column, we propose a very simple rule to assess whether the economy, or more precisely the labour market, is too tight or too slack: are there more job openings than there are unemployed workers? This simple rule has intuitive appeal. If somehow job seekers were to be matched to job openings, would there be excess job openings, suggesting an economy with a shortage of willing workers (i.e. an overly tight labour market), or would there be excess job seekers left, suggesting an economy with too few jobs (i.e. an overly slack labour market)? It turns out that this simple intuitive rule can also be justified using the modern matching model that economists use.2 This reconciles economic theory with the widely scrutinised job-seeker-per-job-opening statistic.3
The Beveridge curve
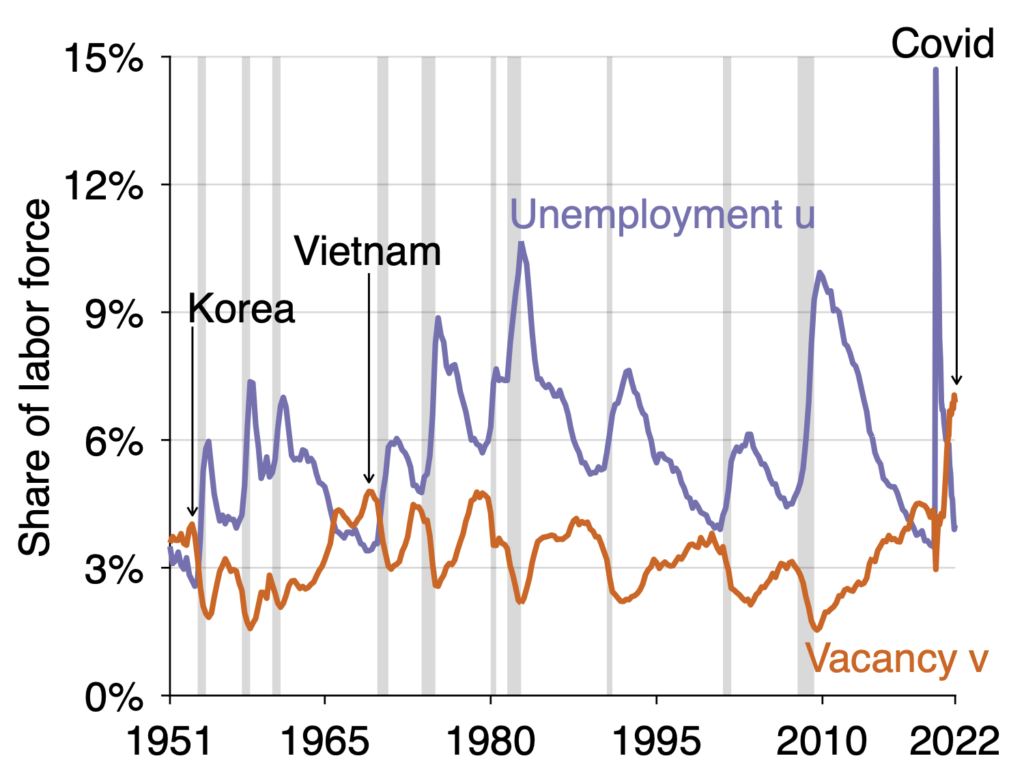
William Beveridge first noted in 1944 that the number of job openings and the number of job seekers in the UK move in opposite directions: When the economy is depressed, there are lots of job seekers and few job openings. Conversely, when the economy is booming, there are few job seekers and many job openings. This relationship has therefore been dubbed the ‘Beveridge curve’ and holds remarkably well in the US as well.4 Figure 1 depicts the time series of the unemployment rate u (all job seekers divided by the labour force which includes all workers and job seekers) and the vacancy rate v (all job openings divided by the same labour force) since 1951. The figure shows clearly that u and v move in opposite directions.”
Figure 1 The US unemployment and vacancy rates since 1951
Continue reading here.
Posted by at 11:28 AM
Labels: Macro Demystified
Subscribe to: Posts