Friday, February 28, 2020
House Prices in Malaysia
From the IMF’s latest report on Malaysia:
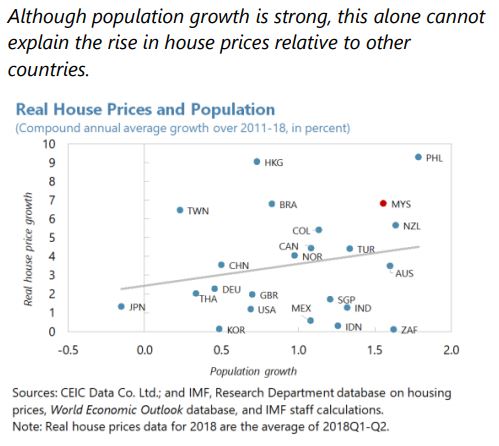
“Over the past decade, real house prices rose faster than income. House prices in Malaysia increased faster than in many regional comparators in the wake of the GFC (text chart). On average real house prices rose by 6 percent in Malaysia annually since 2010, compared with below one percent in regional comparators. At the same time, per capita income in Malaysia grew by around 4 percent annually leading to a deterioration in affordability over this time period (text chart).
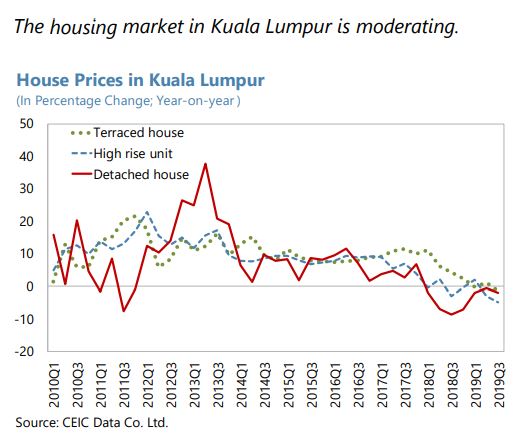
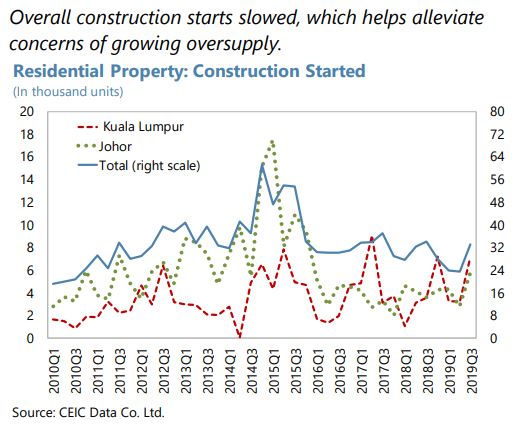
From 2015 onwards, house price growth has moderated from high levels. The average annual nominal house price increase during 2010-14 was 10 percent, but it has declined to an average of 5.5 percent during 2015-19. Most recently, preliminary data indicate that house prices increased by 0.4 percent in 2019Q3 (year-on-year) (text chart). The moderation in house price growth is broad-based across regions, including Kuala Lumpur (text chart).
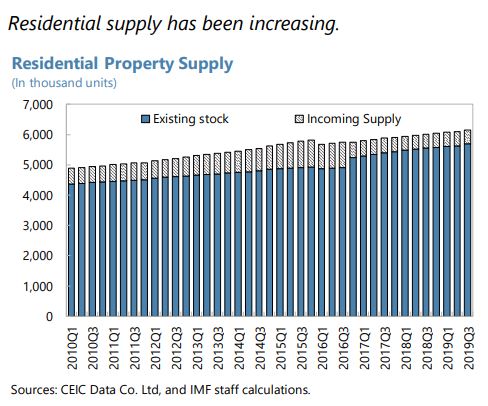
Residential housing supply has responded to higher prices with a lag. Supply factors are important determinants of housing market dynamics, especially considering that residential housing has long planning-to-production lags which can produce temporary supply and demand mismatches. In the aftermath of the GFC, residential property launches plummeted from a peak of nearly 350,000 units before the GFC to a lowest point of 173,000 in 2012 (text chart). The increase in house prices during 2010-15 triggered a strong supply response from 2015 onwards and currently housing starts are well above 300,000.
The strong supply response has led to overproduction in some segments of the market. Affordable housing in Malaysia is usually considered to be below RM300,000.2 Unsold properties in the upper segment (above RM500,000) has increased sharply in 2018-19, particularly in the high-rise apartment segments, whereas recent housing demand has been strong in the lower segments of the market as evidenced by the lower inventory of unsold housing units; unsold units above RM 1 million remain at a high level.
In contrast, there is an undersupply of housing at affordable levels, especially in urban areas. The deterioration of housing affordability can be illustrated in the house price-to-income ratio, which has increased from 4.1 in 2002 to 5.0 in 2016 (see Khazanah Research Institute, 2019). In addition, urban migration has increased housing demand in urban areas. The World Bank (2019) finds that households in Kuala Lumpur and Petaling District with monthly incomes below RM5,000 experience severe unaffordability, and can experience difficulty finding finance given low and often volatile income. Households with incomes from RM6,000-10,000 have moderate difficulty in purchasing a home, while those with incomes above RM10,000 find ample supply within their capacity-to-pay.
House prices are estimated to be moderately overvalued. Using an econometric model with fundamental determinants of house prices such as affordability, per capita income, interest rates, credit growth, working age population and equity share prices, suggest that real house prices remain about 15 percent above what fundamental macroeconomic variables would indicate (Box 1), although the overvaluation has slightly narrowed in recent years as house price increases have moderated.
Along with the increase in house prices, household debt has risen sharply over the past decade. Household debt increased from 60.4 percent of GDP in 2008 to 86.5 percent in 2016. Household debt has stabilized around 82 percent in 2019. Nevertheless, the level of household debt in Malaysia is relatively high by regional standards. Of the total household debt, around 54.5 percent is residential mortgages in 2019. Household debt by monthly income (as a share of total) has decreased for households making less than RM3,000, from 22.8 to 18.5 percent perhaps partly as a result of loan affordability assessments following the introduction of BNM’s Responsible Financing Guidelines in 2012.
High household debt raises financial stability risks, although households also hold substantial assets and non-performing loans are low. Although growth in household debt has moderated in recent years, some households could face increasing stress, particularly if they are over-extended from easier lending conditions in the past and severe income shocks could erode household financial buffers and impact spending (see Nordin et al 2018). Financial stability concerns relating to household debt are cushioned by high household assets (more than twice the debt) of which 2/3 are considered liquid. Moreover, household non-performing loans have declined and are somewhat below the banking sector average of 1.6 percent of total lending.
The concept of “House price at Risk” (HaR) can be used to obtain a measure of worst possible outcome for house prices over a given horizon. Following the approach in IMF (2019), a housing-at-risk approach quantifies the risk of negative house price growth 4-quarters ahead. Specifically, we use the explanatory variables in the econometric model discussed in the appendix to derive a distribution of projected real house price increases four quarters ahead. Using this approach suggests that the mode of house price increase will stabilize around 1.5 percent four quarters ahead (see text chart).”
Continue reading here.


Posted by at 5:10 PM
Labels: Global Housing Watch
Subscribe to: Posts