Tuesday, January 29, 2019
Budget Deficits and Debt: Background and Tradeoffs
From Conversable Economist:
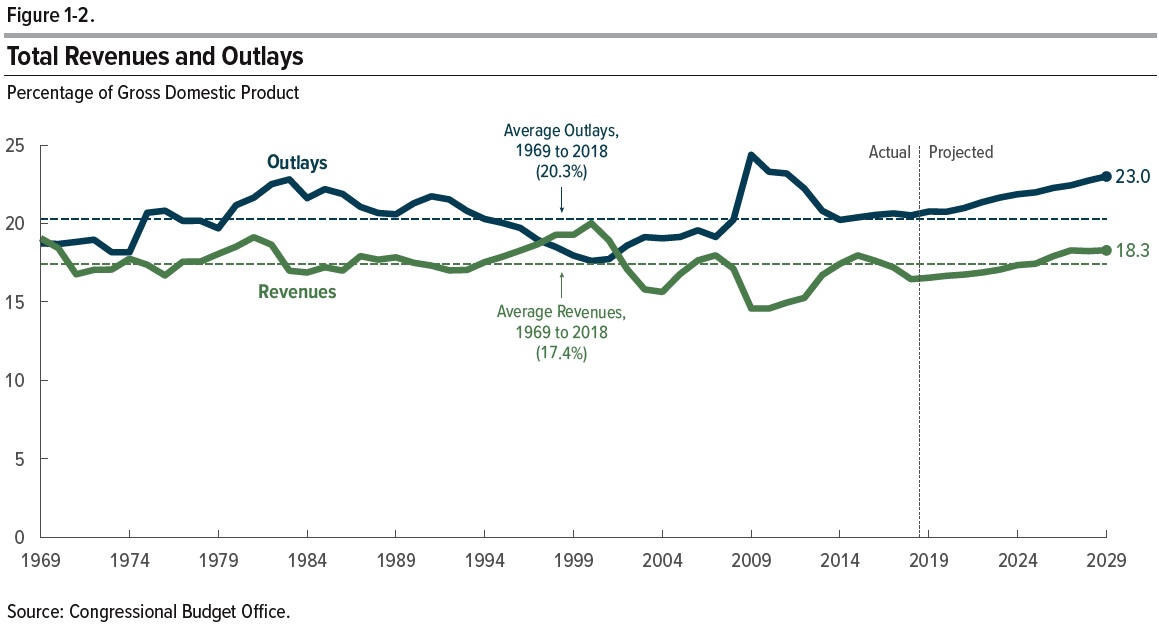
“Twice a year the Congressional Budget Office publishes a “just the facts” overview of the federal budget picture and the US economy. The latest version is “The Budget andEconomic Outlook:2019 to 2029 (January 2019). Here, I’ll focus on the US budget deficit and debt.
Here’s the pattern of US federal government spending and revenues in the last 50 years. Average outlays during that time were 20.7% of GDP. Average revenues were 17.4% of GDP. Contrary to the widespread belief that US government spending and taxes have over time surged ever higher, to me the more obvious pattern here over the half-century is one of stability. Sure, government spending is higher and taxes are lower than the historical averages during the Great Recession. But during boom times like the late 1990s, taxes are above their historical average while spending is below. When President Trump took office early in 2017, US government spending and taxes were–whether for better or worse–almost bang on their long-run averages.
But under the surface, two changes are going on–one medium-term and one longer-term. The medium-term change is that the usual pattern over time has been that when the US economy is proceeding strongly, with sustained growth and a relatively low unemployment rate, the budget deficits are usually lower, or in the late 1990s even turned into surpluses. But at present, the trajectory is a relatively healthy economy but with larger-than-usual budget deficits.
This CBO figures shows that if one looks back at years when the unemployment rate was below 6%, the average budget deficit has been 1.5% of GDP. But although the current unemployment rate has been substantially below 6% for several years, the projected budget deficits for the next decade are projected at 4.4% of GDP.
Continue reading here.
Posted by at 9:34 AM
Labels: Macro Demystified
Subscribe to: Posts