Thursday, December 27, 2018
Top charts of 2018
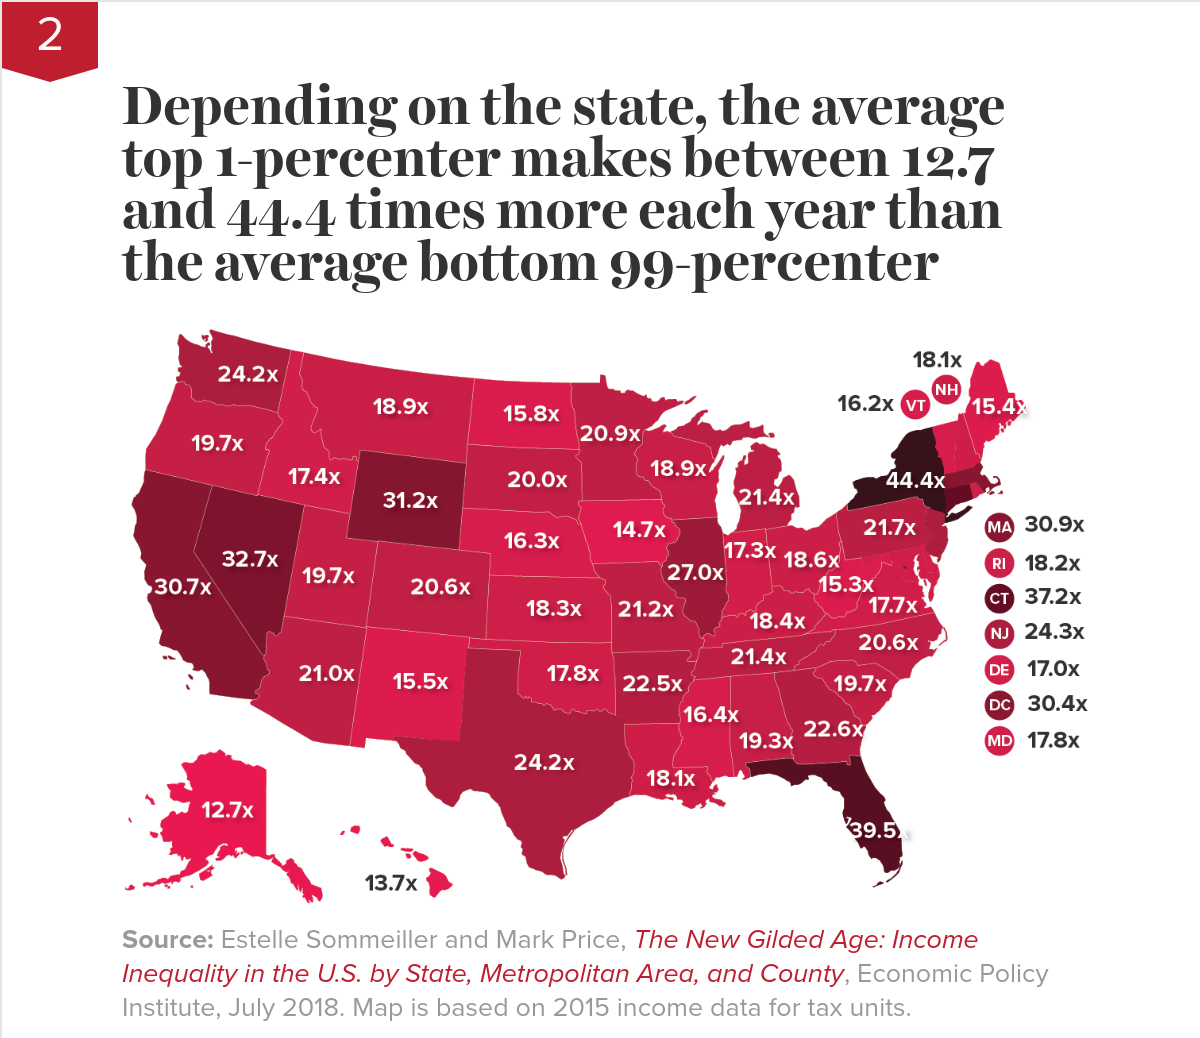
From Economic Policy Institute:
“Twelve charts that show how policy could reduce inequality—but is making it worse instead
With the unemployment rate at 4 percent or below for eight consecutive months, 2018 appears to be the year when the economy finally became healthy again. But while low unemployment is good news, it doesn’t tell the whole story of how typical families are faring in the current economy.
As the economy normalizes following a long, slow recovery from the Great Recession, we are quickly resuming our prerecession course of rising inequality. The fruits of economic growth are bypassing typical families and going straight into the hands of the already-rich.
Our current policy trajectory is doing nothing to reverse the trend of inequality. But it’s doing plenty to widen it. This year’s edition of Top Charts highlights how policy choices continue to exacerbate inequality and how we can achieve more broadly shared prosperity through better policy choices.
Continue reading here.
Posted by at 12:07 PM
Labels: Macro Demystified
Subscribe to: Posts