Thursday, June 1, 2017
Colombia’s Housing Market
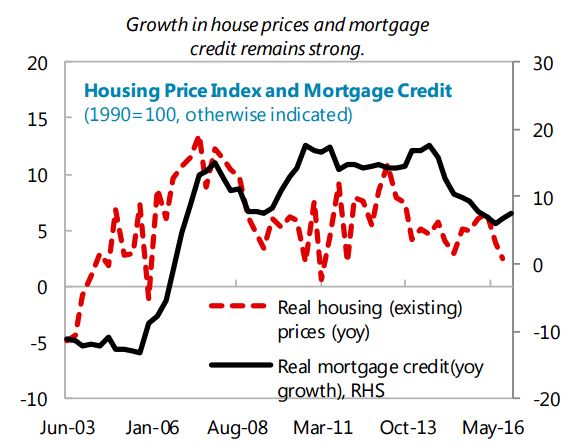
The IMF latest report on Colombia says that “(…) overall credit growth decelerated significantly in 2016. However, the mortgage credit segment has remained resilient with a real growth of 6.8 percent. This is partly due to the various government subsidy programs: around 30 percent of the mortgages originated in 2016 were subsidized. These developments, together with the significant expansion of house prices since 2002, generate questions about the macro-financial risks associated with potential reversals in the housing and mortgage markets. Staff estimated that house prices are slightly misaligned with respect to economic fundamentals, with an estimated price gap of 13.5 percent (…). However, after the 1999 financial crisis the authorities have adopted macroprudential measures such as the use of LTV limits, and other housing financing characteristics (e.g., full recourse, no prepayment penalties, fixed-rate mortgages) that limit the vulnerabilities stemming from the housing market.”
A separate paper “(…) estimates the extent of misalignments in house prices relative to fundamentals and evaluates the overall risk to the economy from the housing sector. The results suggest a moderate house price misalignment relative to fundamentals which is, however, mitigated by housing finance characteristics. ”
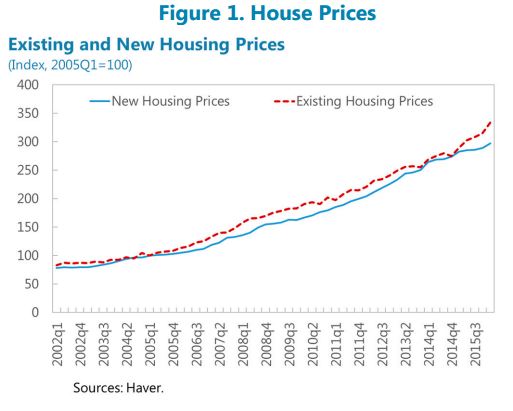
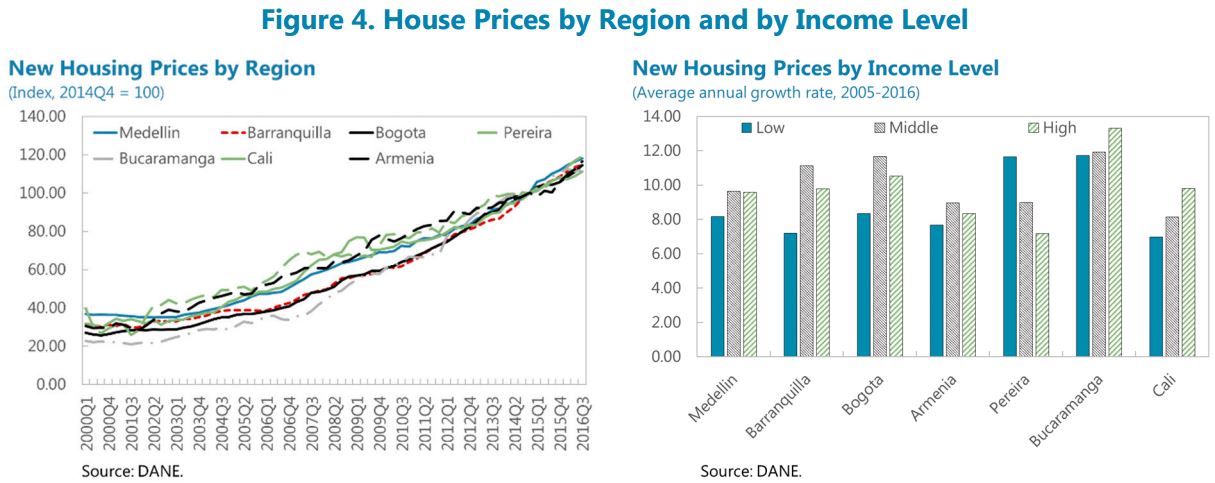
This paper also points out that “The increase in house prices has been widespread across the country. Figure 1 shows that prices for both new and existing houses have increased in the main three cities of Colombia. Figure 4 shows the evolution of prices for new houses in additional cities. Interestingly, house prices grew at high and similar rates in the seven cities considered: the average home-price index grew by an annual real rate of 5.18 percent between 2005 and 2016, with Bucaramanga having the highest average annual real growth rate (8 percent) and Armenia the lowest (3.4 percent). Notwithstanding, in all the cities house prices tended to show stronger growth for middle and upper income levels (Figure 4).”
Posted by at 5:05 PM
Labels: Global Housing Watch
Subscribe to: Posts