Thursday, April 13, 2017
International Experience of Limits on LTV, DSTI, and LTI Ratios
From a new IMF report on Netherlands:
“A growing body of evidence points to the benefit of LTV and DSTI ratios in enhancing resilience and reducing fire-sale dynamics, in housing market downturns. Lee (2012) shows that house prices in Korea fell from 2008, but the delinquency ratio on household loans remained below 1 percent well into 2012, and claims that this implies that strict implementation of limits on LTV and DSTI ratios prevented household defaults even as house prices fell, thus reducing financial institution losses. The Financial Services Authority (2009) finds evidence of a correlation between higher LTV ratios, and higher default rates during 2008 in the United Kingdom Hallissey and others (2014) find that, based on loan-level data in Ireland, the default rate was higher for loans with higher LTV and LTI levels at origination, and that this relationship is stronger for the loans issued at the peak of the housing boom. They also show a positive relationship between LGD and LTV for loans with an LTV greater than 50 percent, with a sharp increase in the losses of defaulted loans at LTVs greater than 85 percent. Wong and others (2011) present cross-country evidence that, for a given fall in house prices (1 percent), the incidence of mortgage default is higher for countries without an LTV ratio limit (1.29 basis points) than for those with such a tool (0.35 basis points). The paper also notes that in the wake of the Asian financial crisis, property prices in Hong Kong SAR dropped by more than 40 percent from September 1997 to September 1998, but the mortgage delinquency ratio remained below 1.43 percent, which suggests that limits on LTV ratio reduced the probability of defaults faced by lenders.”
“Limits on LTV and DSTI ratios have been successful in targeting financial accelerator mechanisms that otherwise lead to a positive two-way feedback between credit growth and house price inflation. A number of studies have found that a tightening of LTV and DSTI ratios is associated with a decline in mortgage lending growth, thereby reducing the risk of an emergence of a housing bubble. Lim and others (2011) find that credit growth declines after limits on LTV and DTI ratios are introduced, and the LTV limits reduce substantially the procyclicality of credit growth. Igan and Kang (2011) show that limits on LTV ratios curb speculative incentives among existing house owners, validating the expectation channel. Crowe and others (2013) confirm the positive association between LTV at origination and subsequent price appreciation using state-level data in the United States—a 10 percentage point increase in the maximum LTV ratio is associated with a 13 percent increase in nominal house prices. Duca and others (2011) estimate that a 10 percentage point decrease in LTV ratio of mortgage loans for first-time buyers is associated with a 10 percentage point decline in the house price appreciation rate. Krznar and Morsink (2014) find that four measures to tighten macroprudential instruments (LTVs, in particular) in Canada were associated with lower mortgage credit and house price growth. IMF (2011) finds that lower LTV ratios reduce the transmission of real GDP growth shocks and shocks to population growth to house prices. Kuttner and Shim (2013) find that an incremental tightening in the DTI ratios is associated with a 4 to 7 percentage point deceleration in credit growth over the following year. RBNZ (2014) suggests that a cap on the share of high-LTV loans was effective, showing a dramatic fall in the share of mortgages over an 80 percent LTV ratio since the introduction in August 2013. Ahuja and Nabar (2011) find that limits on LTV ratios in Hong Kong SAR, where monetary policy is constrained as a small open economy with exchange rate pegs, reduced house prices and transaction volumes, albeit with a lag.”
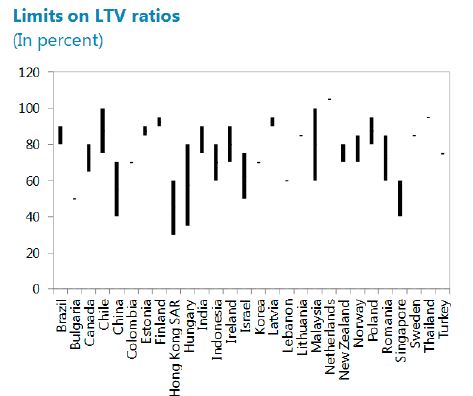
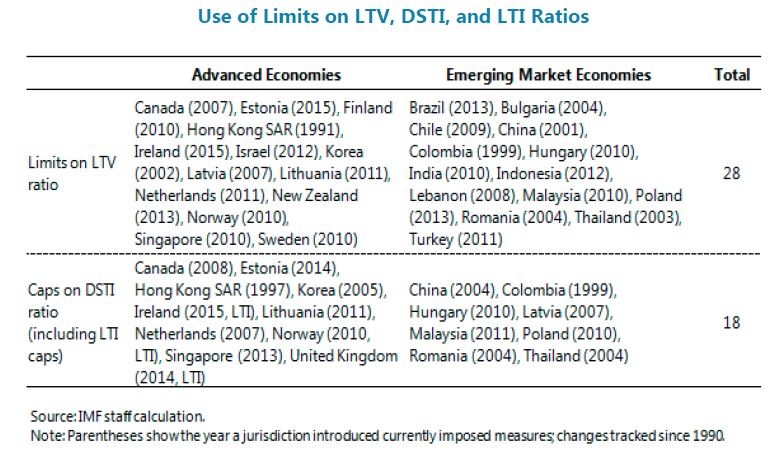
“Since the financial crisis, many countries have newly adopted these instruments. Limits on LTV ratios are below 80 percent in more than half of 28 sample countries, as shown below.”
Posted by at 1:54 PM
Labels: Global Housing Watch
Subscribe to: Posts