Monday, December 12, 2011
GLOBAL HOUSE PRICE MONITOR
Do house prices have more room to fall?
Globally, house prices remain in the doldrums, according to just-released data for 2011:Q3. After a decade of boom, the global house price index peaked in 2007:Q4 and since then has been falling or at best stuck in the basement.
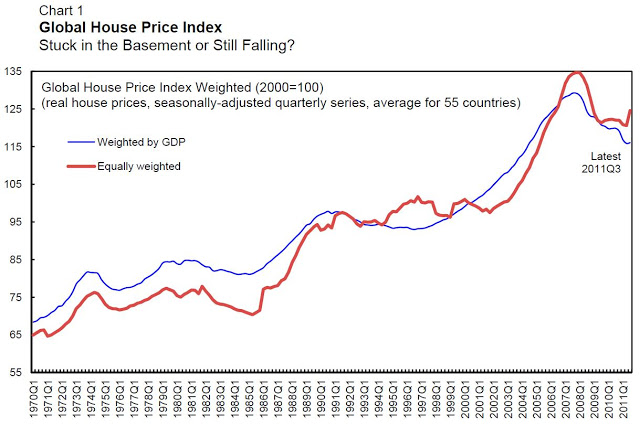
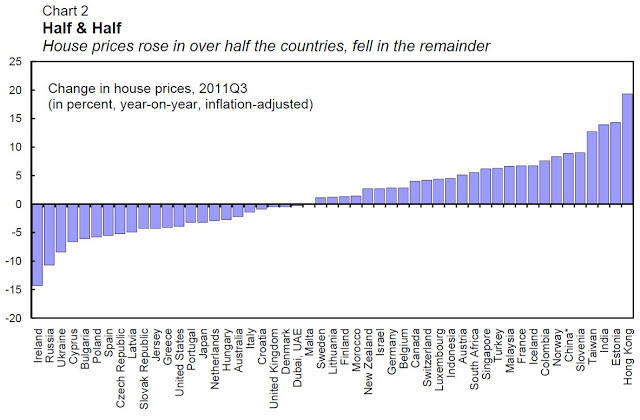
Looking behind the global index, however, reveals the inequality across countries. It’s not quite the 99% vs. the 1%, but more like 50-50: house prices have fallen over the past year in about half the countries and risen in the other half.
More Room to Fall?
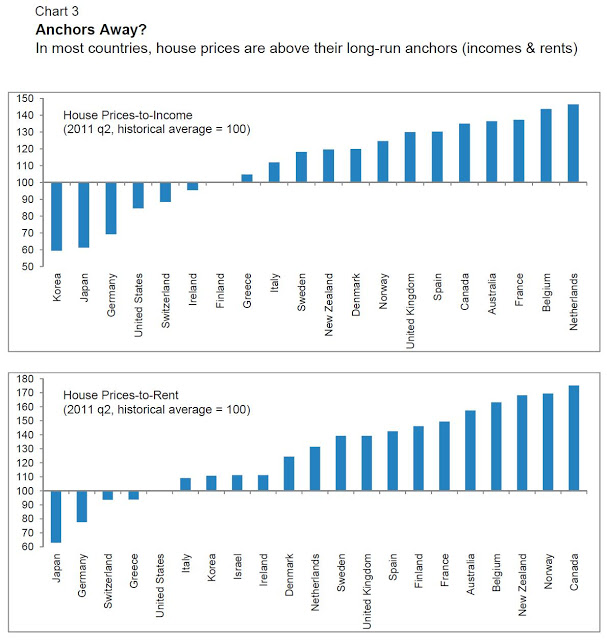
Many factors drive house prices (see: Housing Prices: More Room to Fall? and IMF Research Bulletin article: Seven questions about house price cycles) making it difficult to predict their future course. Two indicators that economists use to predict the direction of change in house prices are the ratio of house prices to income and the ratio of house prices to rents. If these two ratios are above their historical averages, economic theory suggests that declines in house prices may still be in the offing.
How do these indicators look with the latest data on house prices? For all but a handful of countries, these ratios remain above, and in many cases well above, their historical averages, signaling that there may be room to fall.
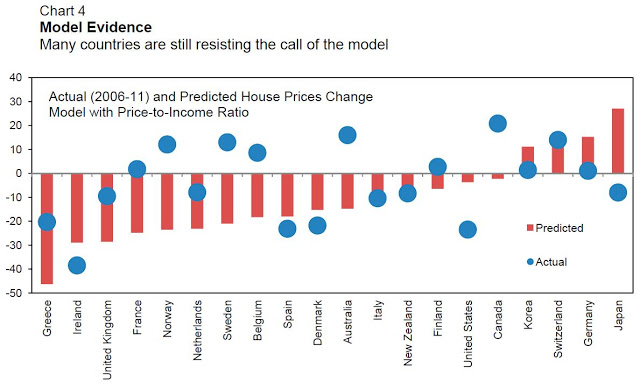
An econometric model of the determinants of house prices, used in the World Economic Outlook (see: House Prices: Corrections and Consequences, and updated here and here ), paints a somewhat different picture. The model explains house price growth based on several short-run momentum factors, such as growth in incomes, asset prices and population, and long-run factors, such as the house price to income ratio. The difference between house prices and those predicted on the basis on these ‘fundamental’ factors gives an indication of whether there is room to fall. The results from this exercise show that in many countries the declines in house prices over the past five years (the ‘actual’) are close to, or even exceed, what was predicted by the model. But for many countries, house prices are still resisting the predictions of the model.
‘This Country is Different’
The indicators presented above are very broad brush. At any time, there are myriad country-specific factors that influence house prices. IMF staff reports for countries often delve into these factors in much detail. Readers interested in developments in house prices in particular countries would be well served by consulting these documents. Links to some recent reports that have featured house price developments are given below.
|
Country
|
Link to report
|
Pages
|
Date
|
|
Australia
|
8
|
Oct-11
|
|
|
Canada
|
30, 36
|
Dec-10
|
|
|
Canada
|
3 to 16
|
Dec-10
|
|
|
China
|
9 to 10
|
Jul-11
|
|
|
Denmark
|
3, 9
|
Dec-10
|
|
|
France
|
24 to 26, 30
|
Jul-11
|
|
|
Korea
|
7, 25
|
Aug-11
|
|
|
Netherlands
|
1, 18, 27
|
Jun-11
|
|
|
Netherlands
|
47 to 55
|
Jun-11
|
|
|
Spain
|
9
|
Jul-11
|
|
|
Sweden
|
9 to 10
|
Jul-11
|
|
|
Switzerland
|
8
|
May-11
|
|
|
United Kingdom
|
8, 10, 30
|
Aug-11
|
|
|
United States
|
19 to 22, 47
|
Jul-11
|
|
|
United States
|
4 to 13
|
Jul-11
|
Also, see two powerpoint presentations on A look at housing prices around the world and Policy Options to Deal With Real Estate Booms.
Posted by at 4:41 PM
Labels: Global Housing Watch
Subscribe to: Posts