Showing posts with label Macro Demystified. Show all posts
Monday, August 8, 2022
Fiscal Histories
From a NBER paper by John H. Cochrane:
“The fiscal theory states that inflation adjusts so that the real value of government debt equals the present value of real primary surpluses. Monetary policy remains important. The central bank can set an interest rate target, which determines the path of expected inflation, while news about the present value of surpluses drives unexpected inflation. I use fiscal theory to interpret historical episodes, including the rise and fall of inflation in the 1970s and 1980s, the long quiet zero bound of the 2010s, and the reemergence of inflation in 2021, as well as to analyze the gold standard, currency pegs, the ends of hyperinflations, currency crashes, and the success of inflation targets. Going forward, fiscal theory warns that inflation will have to be tamed by coordinated monetary and fiscal policy. I thank Erik Hurst, Ed Nelson, Nina Pavcnik, and Timothy Taylor for helpful comments.”
From a NBER paper by John H. Cochrane:
“The fiscal theory states that inflation adjusts so that the real value of government debt equals the present value of real primary surpluses. Monetary policy remains important. The central bank can set an interest rate target, which determines the path of expected inflation, while news about the present value of surpluses drives unexpected inflation. I use fiscal theory to interpret historical episodes, including the rise and fall of inflation in the 1970s and 1980s,
Posted by at 10:16 PM
Labels: Macro Demystified
Globotics and Macroeconomics: Globalisation and Automation of the Service Sector
From a NBER paper by Richard Baldwin:
“Globalisation affects the functioning of the macroeconomy. The macroeconomy’s functioning, in turn, conditions the conduct and impact of monetary policy. This is why globalisation matters for central banks. It is also why central bankers should pay attention to the evolution of globalisation. And evolve it has. This paper argues that the future of trade is trade in services – especially trade in intermediate services. Barriers are radically higher and falling radically faster for services versus goods, and, unlike farm and factory goods, there is no capacity constraint when it comes to the export of intermediate services from emerging markets. Undertaking the macroeconomic analysis for services trade that was done in the 2000s for goods trade, however, will require a substantial upgrading of the data available.”
From a NBER paper by Richard Baldwin:
“Globalisation affects the functioning of the macroeconomy. The macroeconomy’s functioning, in turn, conditions the conduct and impact of monetary policy. This is why globalisation matters for central banks. It is also why central bankers should pay attention to the evolution of globalisation. And evolve it has. This paper argues that the future of trade is trade in services – especially trade in intermediate services.
Posted by at 10:14 PM
Labels: Macro Demystified
Climate Change Around the World
From a NBER paper by Per Krusell & Anthony A. Smith Jr:
“The economic effects of climate change vary across both time and space. To study these effects, this paper builds a global economy-climate model featuring a high degree of geographic resolution. Carbon emissions from the use of energy in production increase the Earth’s (average) temperature and local, or regional, temperatures respond more or less sensitively to this increase. Each of the approximately 19,000 regions makes optimal consumption-savings and energy-use decisions as its climate (or regional temperature) and, consequently, its productivity change over time. The relationship between regional temperature and regional productivity has an inverted U-shape, calibrated so that the high-resolution model replicates estimates of aggregate global damages from global warming. At the global level, then, the high-resolution model nests standard one-region economy-climate models, while at the same time it features realistic spatial variation in climate and economic activity. The central result is that the effects of climate change vary dramatically across space—with many regions gaining while others lose—and the global average effects, while negative, are dwarfed quantitatively by the differences across space. A tax on carbon increases average (global) welfare, but there is a large disparity of views on it across regions, with both winners and losers. Climate change also leads to large increases in global inequality, across both regions and countries. These findings vary little as capital markets range from closed (autarky) to open (free capital mobility).”
From a NBER paper by Per Krusell & Anthony A. Smith Jr:
“The economic effects of climate change vary across both time and space. To study these effects, this paper builds a global economy-climate model featuring a high degree of geographic resolution. Carbon emissions from the use of energy in production increase the Earth’s (average) temperature and local, or regional, temperatures respond more or less sensitively to this increase. Each of the approximately 19,000 regions makes optimal consumption-savings and energy-use decisions as its climate (or regional temperature) and,
Posted by at 10:11 PM
Labels: Macro Demystified
Wednesday, August 3, 2022
Visions of Mahbub
From an article in Tribune by Murtaza Syed:
“Mahbub ul Haq taught me all I know about economics that is ultimately worth knowing. In a nation cruelly short of heroes, Mahbub, my first boss, was a shining light. As Chief Economist of the Planning Commission in the 1960s, he punctured the celebrated high growth rates of the Ayub era. He showed an enraptured domestic audience that state resources had been misused to create powerful monopolies that stifled entrepreneurship and only survived because of subsidies. As a result, the benefits of this growth had been hijacked by a handful of families, who controlled the majority of the country’s land and industrial wealth.
Later, as an adviser to World Bank President Robert McNamara, Mahbub launched a frontal assault on the false god of economic growth and its cathedral on earth, the free play of market forces. He pointed out that across the world, too, growth often fails to translate into better lives for ordinary people. Moreover, he argued that the mythical forces of demand and supply do not work when people are shackled by low purchasing power or a handful has monopoly power. To address this, he saw a vital role for the state in kick-starting the process of growth and ensuring it was equitably shared. Through these insights, he pioneered the paradigm of human development, and with it the vastly influential human development index which looks beyond GDP to capture other vital dimensions of human well-being like decent education, good health, political freedom, cultural identity, personal security, community participation, and environmental security.
Mahbub was a man ahead of his time. His eloquence reverberated on the world stage. He emerged as the spokesperson of the developing world, incessantly appealing to the conscience of richer nations. He is missed every day. Today, a quarter century after his untimely passing, his beloved homeland remains mired in desperate poverty and massive inequality. While most of our neighbours have taken off, we remain stuck at a per capita income of a little over $1,000 and every third person lives on less than $3 a day. Almost half our people are illiterate and less than a quarter of our women work.
Much like in Mahbub’s time, the fault still lies in the engines of our growth and the fickleness of our public policies. Our politicians are obsessed with growth at any cost but pull the wrong levers to achieve it time and time again: lazy, short-term stimulus that inevitably leads to painful busts as opposed to the long and winding road of structural reforms that unleashes prolonged growth through higher productivity and innovation. Short-termism associated with political cycles and an unfortunate lack of preparation and imagination among the economic teams of political parties is to blame.
Pakistan today is a country that can barely grow above 4-5% without finding itself hobbled by a current account deficit it cannot finance. Its growth model is too reliant on consumption, which accounts for a staggering 95% of overall output, while investment and exports make up just 15 and 10%, respectively. As a result, the country runs a perennial current account deficit, in stark contrast to the surpluses generated by the high-saving Asian tigers of the 1970s and 1980s.’
Continue reading here.
From an article in Tribune by Murtaza Syed:
“Mahbub ul Haq taught me all I know about economics that is ultimately worth knowing. In a nation cruelly short of heroes, Mahbub, my first boss, was a shining light. As Chief Economist of the Planning Commission in the 1960s, he punctured the celebrated high growth rates of the Ayub era. He showed an enraptured domestic audience that state resources had been misused to create powerful monopolies that stifled entrepreneurship and only survived because of subsidies.
Posted by at 9:40 AM
Labels: Macro Demystified
Monday, August 1, 2022
Is this a recession?
From Econbrowser:
“The Bureau of Economic Analysis announced today that seasonally adjusted U.S. real GDP fell at a 0.9% annual rate in the first quarter. That makes two quarters in a row of falling real GDP, which is one rule of thumb for declaring the economy to be in a recession. The current economic weakness could certainly develop into a recession. But the evidence isn’t convincing that a recession is already under way.
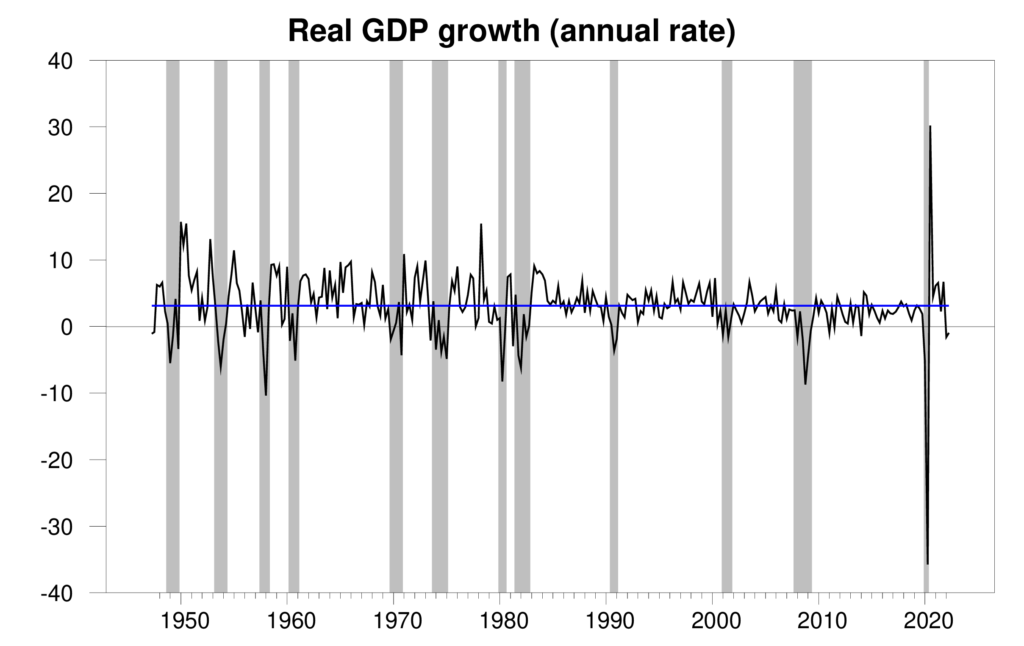
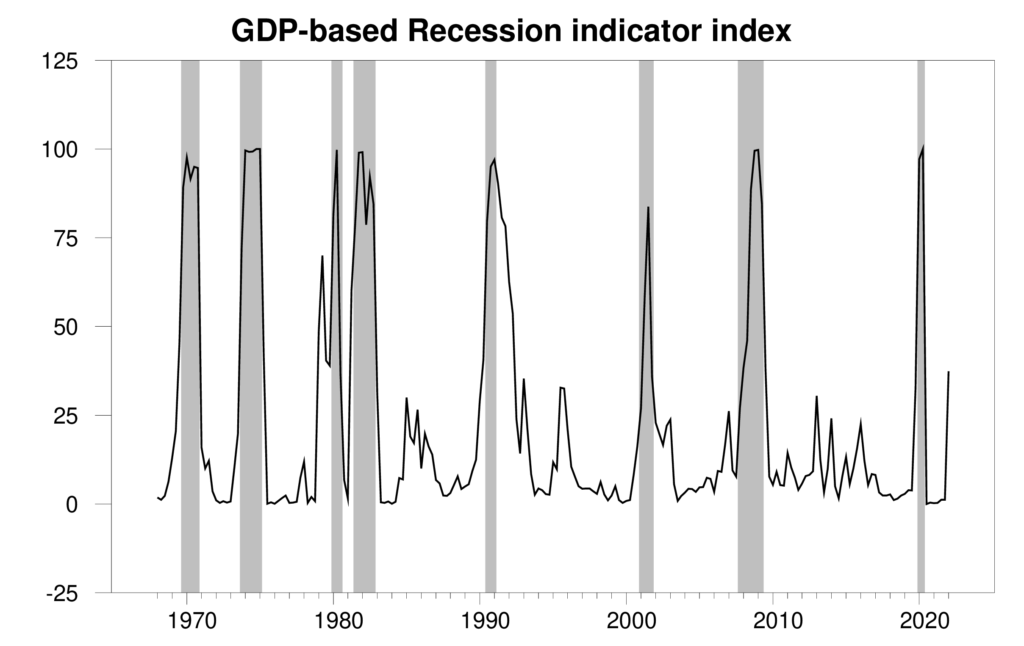
The new data raised the Econbrowser recession indicator index up to 37.4%, flashing a clear warning sign. This is an assessment of the situation of the economy in the previous quarter (namely 2022:Q1). The index takes into account the fact that we’ve now seen two consecutive quarters of falling GDP, but still finds the evidence inconclusive as to whether the U.S. economy started a recession in the first quarter. When Marcelle Chauvet and I first developed this index 17 years ago, we announced that we would only declare a recession to have started when the index rises to 65% (see pages 14-15 in our original paper). If the Q3 GDP report causes the index to rise above 65%, we would announce a recession at that time, and also use the full range of revised historical data available at that time to determine the date at which the recession likely started. Here at Econbrowser we’ve followed that procedure to the letter as the data unfolded in real time over the last 17 years, successfully dating in real time the beginning and end of the two recessions since we started this blog.”
Continue reading here.
From Econbrowser:
“The Bureau of Economic Analysis announced today that seasonally adjusted U.S. real GDP fell at a 0.9% annual rate in the first quarter. That makes two quarters in a row of falling real GDP, which is one rule of thumb for declaring the economy to be in a recession. The current economic weakness could certainly develop into a recession. But the evidence isn’t convincing that a recession is already under way.
Posted by at 8:22 AM
Labels: Macro Demystified
Subscribe to: Posts