Showing posts with label Inclusive Growth. Show all posts
Wednesday, March 27, 2019
The Return of the Policy That Shall Not Be Named: Principles of Industrial Policy
From a new IMF working paper by Reda Cherif and Fuad Hasanov:
“Industrial policy is tainted with bad reputation among policymakers and academics and is often viewed as the road to perdition for developing economies. Yet the success of the Asian Miracles with industrial policy stands as an uncomfortable story that many ignore or claim it cannot be replicated. Using a theory and empirical evidence, we argue that one can learn more from miracles than failures. We suggest three key principles behind their success: (i) the support of domestic producers in sophisticated industries, beyond the initial comparative advantage; (ii) export orientation; and (iii) the pursuit of fierce competition with strict accountability.”
From a new IMF working paper by Reda Cherif and Fuad Hasanov:
“Industrial policy is tainted with bad reputation among policymakers and academics and is often viewed as the road to perdition for developing economies. Yet the success of the Asian Miracles with industrial policy stands as an uncomfortable story that many ignore or claim it cannot be replicated. Using a theory and empirical evidence, we argue that one can learn more from miracles than failures.
Posted by at 8:19 AM
Labels: Inclusive Growth
Friday, March 22, 2019
The Structural Determinants of the Labor Share in Europe
From a new IMF working paper by Dilyana Dimova:
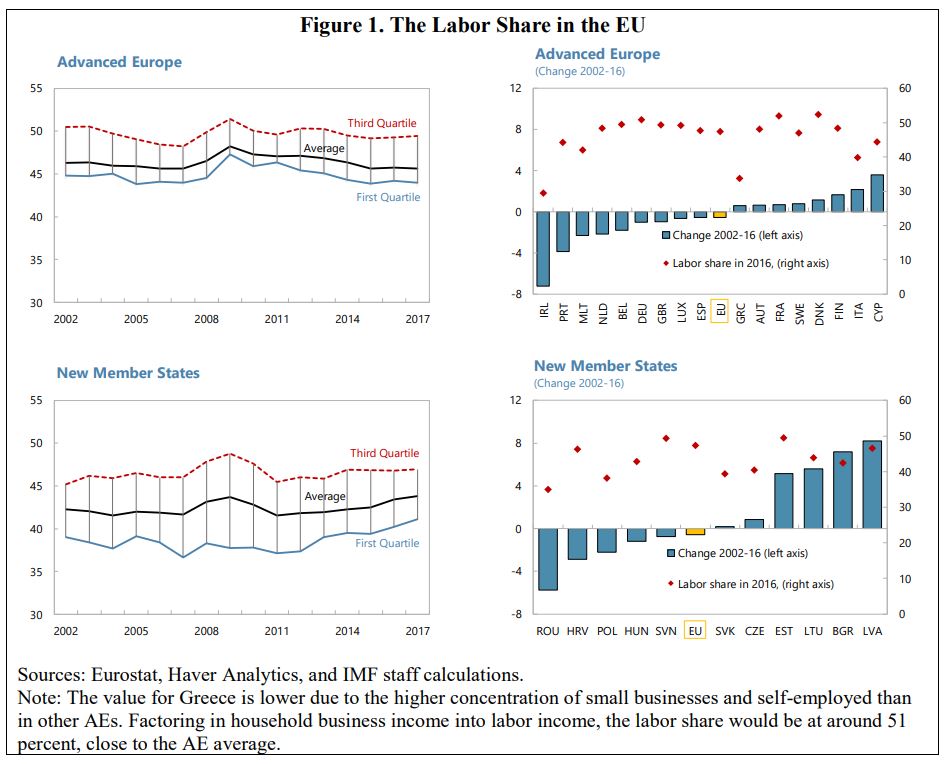
“The labor share in Europe has been on a downward trend. This paper finds that the decline is concentrated in manufacture and among low- to mid-skilled workers. The shifting nature of employment away from full-time jobs and a rollback of employment protection, unemployment benefits and unemployment benefits have been the main contributors. Technology and globalization hurt sectors where jobs are routinizable but helped others that require specialized skills. High-skilled professionals gained labor share driven by productivity aided by flexible work environments, while low- and mid-skilled workers lost labor share owing to globalization and the erosion of labor market safety nets.
The value-added share accrued to labor commonly known as the labor share—the ratio of labor compensation (wages and benefits) to national income—has been on a downward trend in the EU in the last couple of decades (Figure 1). This trend is observed both in recession-hit Advanced Economies (AE) like Ireland, Portugal and Spain as well as in economically prosperous Germany and the Netherlands (Figure 1, upper panels), and began around 2012–13 after the Great Recession (GR). In New Member States (NMS), Estonia, Hungary, Latvia and Lithuania experienced a decline in 2009–15 and are on the rebound (Figure 1, lower panels). Other NMS economies such as Croatia, Poland and Romania have yet to return to their 2002 levels. The positive exception is Bulgaria whose labor share has been on an upward trend due to an economic deepening from relatively low levels.
This paper looks at the evolution of the labor share by industry and by skill level and considers the effect of various structural factors on the EU-wide stagnation and erosion of the labor share. Following Dao et al. (2017), first a shift-share analysis is used to demonstrate the extent to which the downward trend in the labor share is driven by within-sector/skill category declines or by changes across sectors/skill category. The analysis establishes that within-sector/skill category changes account for the majority of labor share fluctuations and provides justification for the structural factor analysis. Then the paper quantifies the extent to which structural drivers track changes in the labor share in 28 EU-member countries, representing both advanced economies and transitional economies, in a cross-country panel study that uses disaggregated data for twelve industry sectors and three skill categories.”
From a new IMF working paper by Dilyana Dimova:
“The labor share in Europe has been on a downward trend. This paper finds that the decline is concentrated in manufacture and among low- to mid-skilled workers. The shifting nature of employment away from full-time jobs and a rollback of employment protection, unemployment benefits and unemployment benefits have been the main contributors. Technology and globalization hurt sectors where jobs are routinizable but helped others that require specialized skills.
Posted by at 4:37 PM
Labels: Inclusive Growth
Tuesday, March 19, 2019
Unemployment Surges in the EU: The Role of Risk Premium Shocks
From a new IMF working paper:
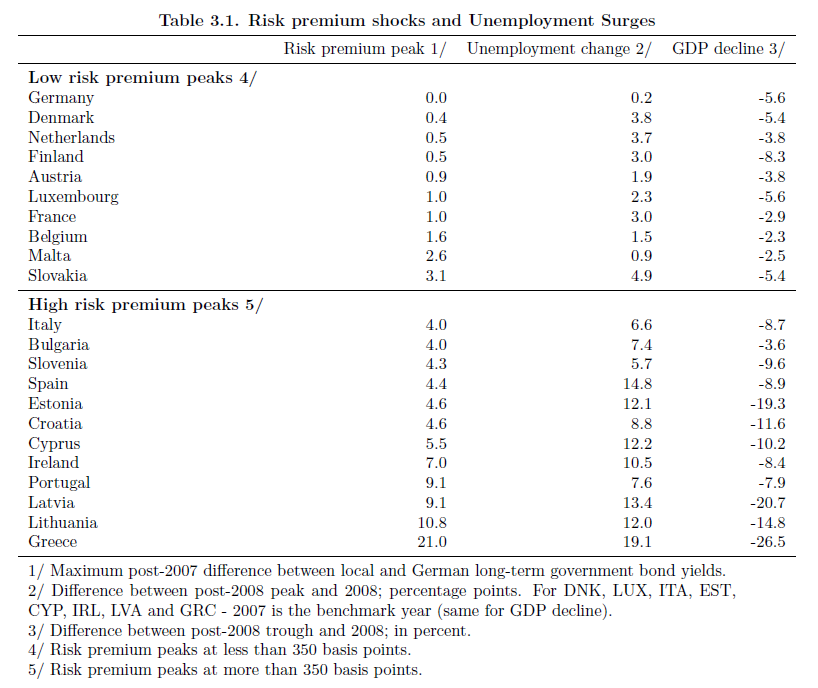
“In the last decade, over half of the EU countries in the euro area or with currencies pegged to the euro were hit by large risk premium shocks. Previous papers have focused on the impact of these shocks on demand. This paper, by contrast, focuses on the impact on supply. We show that risk premium shocks reduce the output level that maximizes profit. They also lead to unemployment surges, as firms are forced to cut costs when financing becomes expensive or is no longer available. As a result, all countries with risk premium shocks saw unemployment surge, even as euro area core countries managed to contain unemployment as firms hoarded labor during the downturn. Most striking, wage bills in euro area crisis countries and the Baltics declined even faster than GDP, whereas in core euro area countries wage shares actually increased.”
From a new IMF working paper:
“In the last decade, over half of the EU countries in the euro area or with currencies pegged to the euro were hit by large risk premium shocks. Previous papers have focused on the impact of these shocks on demand. This paper, by contrast, focuses on the impact on supply. We show that risk premium shocks reduce the output level that maximizes profit. They also lead to unemployment surges,
Posted by at 1:28 AM
Labels: Inclusive Growth
Wednesday, March 13, 2019
Optimising Production: Industrial Policies in Networks
From a new VoxChina post:
“Many developing countries adopt industrial policies favoring upstream sectors. Liu (2018) shows these policies might enhance aggregate production efficiency. When sectors form a production network, market imperfections generate distortions that compound through input demand linkages, accumulating into upstream sectors and creating an incentive for well-meaning governments to subsidize these sectors. The study proposes the measure “distortion centrality,” which is a sufficient statistic that can guide policy interventions in arbitrary networks. Distortion centrality predicts sectors that were promoted in South Korea in the 1970s and modern-day China, suggesting that these policies might have generated positive aggregate effects.”
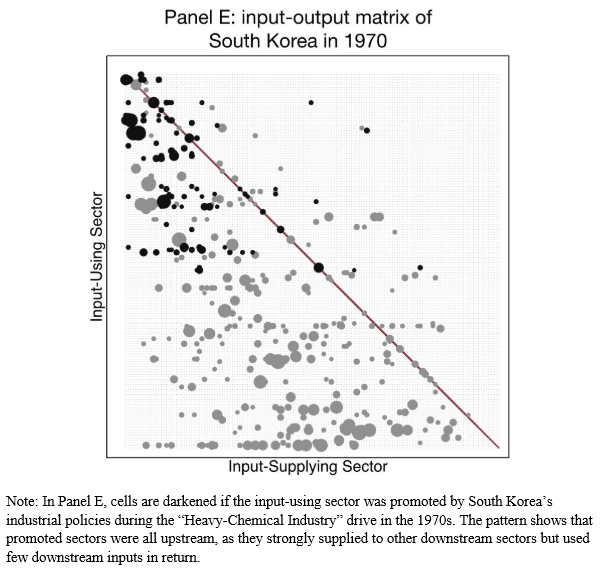
“I find that the heavy and chemical sectors promoted by South Korea in the 1970s were upstream (as visibly evident from Figure 2E) and had significantly higher distortion centrality than non-targeted sectors, suggesting that government interventions contributed positively to aggregate economic performance.
In modern-day China, non-state-owned firms in sectors with higher distortion centrality have significantly better access to loans, receive more favourable interest rates, and pay lower taxes. These sectors also tend to have more state-owned enterprises, to which the government directly extends credit and policy subsidies.
My quantitative analysis reveals that in China, differential sectoral interest rates, tax incentives, and funds given to state-owned enterprises all generate positive aggregate effects and, taken together, improve aggregate efficiency by 4.8%. Moreover, distortion centrality correlates negatively with sectoral size, suggesting that promoting large sectors would lead to aggregate losses.”
From a new VoxChina post:
“Many developing countries adopt industrial policies favoring upstream sectors. Liu (2018) shows these policies might enhance aggregate production efficiency. When sectors form a production network, market imperfections generate distortions that compound through input demand linkages, accumulating into upstream sectors and creating an incentive for well-meaning governments to subsidize these sectors. The study proposes the measure “distortion centrality,” which is a sufficient statistic that can guide policy interventions in arbitrary networks.
Posted by at 2:46 PM
Labels: Inclusive Growth
Confronting Inequality: How Societies Can Choose Inclusive Growth
Posted by at 8:53 AM
Labels: Inclusive Growth
Subscribe to: Posts