Showing posts with label Global Housing Watch. Show all posts
Friday, November 12, 2021
Housing View – November 12, 2021
On cross-country:
- Prime Global Cities Index – Q3 2021 – Knight Frank
On the US:
- The U.S. Housing and Mortgage Market: Risks and Resilience – FED
- Fed’s Bowman sees risks in housing market, flags inflation pressure – Reuters
- A different kind of housing bubble – FT
- ‘Zillow: the models underneath a housing hedge fund did not hold. Company deserves credit for pulling the plug quickly and retreating to its successful core – FT
- How Zillow got rocked by the housing market – Quartz
- Zillow’s home-buying debacle shows how hard it is to use AI to value real estate – CNN
- Single-Family Rental Firms Eye Zillow’s Housing Stock. Interest comes as Zillow gets ready to shut down its home-flipping business – Wall Street Journal
- A whodunnit on Zillow. Lessons for America’s housing market – The Economist
- Red-Hot Housing Market Drives Biggest Home-Equity Drawdown Since 2007. Homeowners are tapping into their properties’ equity to fund renovations, invest in stocks and more. – Wall Street Journal
- Why Home Buyers Should Comparison Shop for Mortgage Rates—but Don’t. Even a small difference among interest-rate offerings can add up to noticeable savings – Wall Street Journal
- The Price of Living in ‘Paradise’ Is Higher Than Ever. Land and homes in Hawaii, never inexpensive, are more in demand in these days of remote working — as in remote from the U.S. mainland. – New York Times
- COVID, Race, and Housing Insecurity – Harvard University
- A surge in the US affordable housing supply is coming from people who can’t afford their homes – Quartz
- Will the Democrats’ ‘Build Back Better’ Bill Do Anything to Fix Zoning? Will the “Unlocking Possibilities” program be an effective way to spark zoning reforms—or just a subsidy to planning consultants? – Reason
- Movie studios are good neighbors – if you like rising house prices – LSE
- How Data Is Reshaping Real Estate. Tech start-ups are offering new tools to help retailers and entertainment venues be more efficient by counting crowds, tracking foot traffic and following local shopping habits. – New York Times
- The Possible Impacts of Remote Work on Cities, Neighborhoods, and Households – Harvard Joint Center for Housing Studies
- Schumer scores billions for New York’s decaying public housing. The jockeying over the housing funds is one of many emerging sources of political tension surrounding President Joe Biden’s bill. – Politico
- Rent Control Backfires Again in St. Paul. Voters put on a 3% cap. You’ll never guess what developers did next. – Wall Street Journal
On China
- China struggles to regulate house prices despite glut of controls. Evergrande debt crisis prompts other developers to offer discounts, worrying authorities – FT
- Fed warns ailing China real estate sector poses risks to US economy. Central bank also monitoring volatility in meme stocks, per closely watched semi-annual report – FT, New York Times and CNBC
- Chinese developer Kaisa pleads for help as Fed warns of risks – Reuters
- Evergrande dodges default again; property sector debt concerns linger – Reuters
- China’s Plan to Manage Evergrande: Take It Apart, Slowly. Beijing is working on a controlled implosion of the real-estate giant, selling off some assets while limiting damage to home buyers and businesses – Wall Street Journal
- Kaisa says trying to solve liquidity issues, pleads for ‘more time and patience’ – Reuters
- Chinese developer Kaisa pleads for ‘patience’ as market strife spreads. Real estate groups including Evergrande rush to sell assets as contagion reaches higher-rated debt – FT
- As China’s Property Crisis Spreads, Beijing Says There’s Nothing to See. Global markets just weeks ago were fretting over the possible failure of Evergrande. Now the developer says the worst is over, even as other companies show signs of trouble. – New York Times
- China’s Economy Faces Risk of Yearslong Real-Estate Hangover. Booming market helped juice growth for more than a decade; without it, China could struggle to match previous pace, economists say – Wall Street Journal
- Deadline looms for Evergrande payment amid contagion fears – Al Jazeera
- Speculation nation: Can Xi Jinping’s property tax deflate China’s housing bubble? President faces an uphill battle to undo a system that has led to a bloated property sector – The Guardian
- China doesn’t have a housing bubble. Here’s why. China needs a large and vibrant real-estate sector to build enough housing in its big cities to meet the urbanisation demand in the next 10-20 years. Its high levels of savings and investment should also be seen as a blessing, especially given the costly necessary transition to clean energy – South China Morning Post
- China’s harsh medicine for property sector, local government debt could cause chaos, economists warn
- Beijing’s stricter regulation of local government borrowing and real estate developers increase the risks that some of them may run out of cash, analysts say. Defusing financial risk was one of three economic priorities set by Chinese President Xi Jinping four years ago, which has seen scrutiny of hidden local government debts – South China Morning Post
- How does Affordable Housing Supply Affect Commercial Housing Prices: Crow out Supply or Divert Demand?- Journal of Finance and Economics
- China real estate firms may issue inter-bank market debt – Securities Times – Reuters
- Why China’s Real Estate Slowdown Isn’t Like Japan’s – Bloomberg
On other countries:
- [Australia] Widespread money laundering in property locking out Australians from owning homes, Senate told. Australia now ‘destination of choice’ for flow of illicit funds, anti-corruption expert says – The Guardian
- [Hong Kong] Hong Kong’s property barons set to benefit from affordable housing drive. City’s developers well-positioned to capitalise on Beijing’s efforts to promote social justice – FT
- [Ireland] Remote working linked to surge in house prices outside Dublin. Increased demand from those looking to relocate putting pressure on rural prices – The Irish Times
- [New Zealand] One of the World’s Hottest Real-Estate Markets Tries to Cool Down. New Zealand is pulling every lever to tame property prices without shaking its economy and crashing the market – Wall Street Journal
- [United Kingdom] How does house price indexation affect the valuation of equity release mortgages? – Bank of England
- [United Kingdom] Return of super-rich to central London fuels house price surge. Property prices in city’s most expensive district rise by almost 7% as Covid restrictions ease – The Guardian
- [United Kingdom] Signs of a cooling housing market are too late for those hoping for better affordability. Talk has turned to an interest rate rise but the RBA says that’s still a way off – The Guardian
- [United Kingdom] Higher interest rates mean more expensive mortgages. But changes in the British housing market mute their effect – The Economist
- [United Kingdom] Property prices fall in upmarket London boroughs. Westminister and Kensington and Chelsea among those hit by pandemic-driven ‘race for space’ – FT
- [United Kingdom] Will UK house prices fall as interest rates rise? While rates are expected to rise over the next year, forecasts about price growth vary from a slowdown to an outright contraction – FT
On cross-country:
- Prime Global Cities Index – Q3 2021 – Knight Frank
On the US:
Posted by at 5:00 AM
Labels: Global Housing Watch
Friday, November 5, 2021
Housing View – November 5, 2021
On the US:
- 2022 home prices will keep rising at or near double digits, predicts the analyst who called the current housing boom – American Enterprise Institute
- Flattening the curve: Pandemic-Induced revaluation of urban real estate – Journal of Financial Economics
- Supporting Philadelphia’s Black Homeowners in the Aftermath of the COVID-19 Crisis – Philadelphia Fed
- Introducing the Brookings and Ashoka Collaborative Innovation Challenge: Valuing Homes in Black Communities – Brookings
- Affordable Housing as a Pathway to Economic Opportunity – Harvard University
- Desperate for Housing Options, Communities Turn to Ballot Initiatives. Cities and counties will vote on measures, like tax increases and curbs on Airbnb, aimed at creating more affordable housing. – New York Times
- In a Supertall Tower, How Much Affordable Housing Is Enough? The only residential building at the World Trade Center will be 25 percent affordable — a real accomplishment, supporters say. Others insist it should be 100 percent. – New York Times
- ‘Palm Beach is sold out’ after frenzied pandemic property sales. Prices are rising as millionaires are priced out by billionaires, pushing them to nearby West Palm Beach – FT
- As Boomers Downsize, Competition Grows for Simpler—but Not Always Smaller—Homes. Smaller houses, desired by aging seniors and young couples, are among the toughest to find – Wall Street Journal
- ‘Gimme Shelter’: Meet California’s housing chiefs – Los Angeles Times
- States under time crunch to provide housing assistance: How to fix it – Brookings
- ‘Don’t Buy Zillow Homes’: A Tale of Failure, Mistrust and Hot Housing Markets. Twitter and TikTok users are raging against the real estate firm as it looks to sell 7,000 homes for $2.8 billion following the failure of a much-vaunted business. – Bloomberg
- Could Zillow buy the neighborhood? iBuyers want to be the Amazon of real estate. What does that mean for the rest of us? – Vox
- Zillow May Have Stumbled, But iBuying Is Here to Stay – Barron’s
- Strip Malls to Homes: An Analysis of Commercial to Residential Conversions in – Terner Center for Housing Innovation
- AEI housing market indicators, October 2021 – American Enterprise Institute
- Institutional Investors Have a Comparative Advantage in Purchasing Homes That Need Repair – Urban Institute
- Eviction and Voter Turnout: The Political Consequences of Housing Instability – Princeton University
On China
- China’s long wait for a tax everyone loves to hate. The government will at last roll out a property tax – The Economist
- The strongest weapon in Xi Jinping’s common prosperity armoury is a property tax – Quartz
- How China’s property crackdown is being felt in a remote city steeped in Communist Party lore. Beijing’s push to reduce excessive borrowing in the property sector and tame house prices is hurting regional finances. The policy tightening could be related to the current political cycle ahead of the 20th Party Congress, some analysts say – South China Morning Post
- Why China May Not Bail Out Evergrande. A complicated political calculus goes into which businesses Beijing cares about most. – Foreign Policy
- Why Beijing will endure property tax’s drag on housing market – South China Morning Post
On other countries:
- [Australia] Australia’s Hot Housing Market Shows Signs of Cooling Momentum – Bloomberg
- [Australia] Borrowers rush to lock in low interest rates amid expectations of RBA rise. Rising house prices and a resurgent economy could nudge the Reserve Bank to raise rates for first time in 11 years – The Guardian
- [Brazil] Estimating the Economic Value of Zoning Reform – NBER
- [Brazil] How to improve access to housing for the low-income population? – IADB
- [Canada] Bank of Canada’s early lift-off warning may dampen housing boom fanned by speculators – Reuters
- [Hong Kong] What Hong Kong must do to solve the city’s perennial housing and land shortage problems – South China Morning Post
- [Israel] Israel Plans AirBnB Restrictions, Taxes to Curb Housing Prices – Bloomberg
- [Italy] Living on my own: The impact of the Covid-19 pandemic on housing demand – Bank of Italy
- [New Zealand] Growing supply will bring down New Zealand house prices, says RBNZ’s Orr – Reuters
- [United Kingdom] Homeowners face biggest hike in mortgage costs since 2008. Data from government’s independent forecasting unit suggests interest payments could increase by 13% in 2023 – The Guardian
- [United Kingdom] Surge in mortgage lending prompted by stamp duty deadline. The end of the tax break in September fuelled lending but the outlook for approvals remains ‘resilient’ – FT
- [United Kingdom] Rising Interest Rates Expected to Cool U.K. Housing Market – Bloomberg
On the US:
- 2022 home prices will keep rising at or near double digits, predicts the analyst who called the current housing boom – American Enterprise Institute
- Flattening the curve: Pandemic-Induced revaluation of urban real estate – Journal of Financial Economics
- Supporting Philadelphia’s Black Homeowners in the Aftermath of the COVID-19 Crisis – Philadelphia Fed
- Introducing the Brookings and Ashoka Collaborative Innovation Challenge: Valuing Homes in Black Communities – Brookings
- Affordable Housing as a Pathway to Economic Opportunity – Harvard University
- Desperate for Housing Options,
Posted by at 5:00 AM
Labels: Global Housing Watch
Wednesday, November 3, 2021
Flattening the curve: Pandemic-Induced revaluation of urban real estate
From a new paper by Arpit Gupta, Vrinda Mittal, Jonas Peeters, and Stijn Van Nieuwerburgh:
“We show that the COVID-19 pandemic brought house price and rent declines in city centers, and price and rent increases away from the center, thereby flattening the bid-rent curve in most U.S. metropolitan areas. Across MSAs, the flattening of the bid-rent curve is larger when working from home is more prevalent, housing markets are more regulated, and supply is less elastic. Housing markets predict an urban revival with urban rent growth exceeding suburban rent growth for the foreseeable future, as working from home recedes.”
From a new paper by Arpit Gupta, Vrinda Mittal, Jonas Peeters, and Stijn Van Nieuwerburgh:
“We show that the COVID-19 pandemic brought house price and rent declines in city centers, and price and rent increases away from the center, thereby flattening the bid-rent curve in most U.S. metropolitan areas. Across MSAs, the flattening of the bid-rent curve is larger when working from home is more prevalent, housing markets are more regulated,
Posted by at 7:45 AM
Labels: Global Housing Watch
Tuesday, November 2, 2021
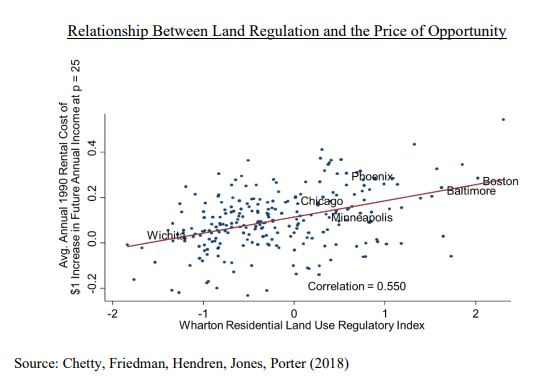
Affordable Housing as a Pathway to Economic Opportunity
From Raj Chetty’s (Harvard University) Testimony Before the House Financial Services Committee:
“Stable housing in high-opportunity neighborhoods can provide a critical foundation for a variety of outcomes such as future earnings, health, and education. Failing to meet our children’s basic housing needs serves to worsen already-stark racial and economic disparities and bar generations from growing up and joining the middle class.
Today, we have an unprecedented opportunity to expand access to neighborhoods that research shows are foundational to children’s and families’ long-term success. Well-designed expansions of the Housing Choice Voucher program, public housing investments, the Housing Tax Credit, and place-based investments could significantly increase housing supply and access to opportunity. Such investments can give all children an opportunity to grow-up in communities that will support their long-term success.
More broadly, to achieve long-term mobility for all children in the United States, we must reduce historic patterns of segregation that have limited access to opportunity-rich neighborhoods, particularly for Black and Hispanic Americans. Equally important, we must also increase opportunity in communities that do not presently see such outcomes. Expanding access to affordable housing can be valuable on both fronts. We must continue to deploy our resources towards increasing options for low- and middle-income families living in areas currently offering high levels of opportunity, and simultaneously to maintain and expand high-quality housing options and community development efforts in areas that currently offer lower levels of opportunity. These strategies will help ensure that all families have a true choice about where to live, reduce the present bifurcation between ‘high’ and ‘low; opportunity areas across the country, and give all children – irrespective of their race, ethnicity, or family income – a chance of achieving the American Dream.”
From Raj Chetty’s (Harvard University) Testimony Before the House Financial Services Committee:
“Stable housing in high-opportunity neighborhoods can provide a critical foundation for a variety of outcomes such as future earnings, health, and education. Failing to meet our children’s basic housing needs serves to worsen already-stark racial and economic disparities and bar generations from growing up and joining the middle class.
Today, we have an unprecedented opportunity to expand access to neighborhoods that research shows are foundational to children’s and families’ long-term success.
Posted by at 7:06 AM
Labels: Global Housing Watch
Friday, October 29, 2021
Housing View – October 29, 2021
On cross-country:
- Do Credit Conditions Move House Prices? – NBER
- Call for Papers: ESCP-TAU-UCLA Conference on Low-Income Housing Supply and Housing Affordability, June 14-16, 2022 – American Real Estate and Urban Economics Association
- Call for Policy Papers on Rethinking Cities for Resilience and Growth in the Post-COVID-19 World – Asian Development Bank Institute
On the US:
- Should You Buy a Home in the US? – Project Syndicate
- NY Fed’s Williams says rising home prices don’t pose financial stability risks – Reuters
- America’s Housing Boom Will Keep Builders and Agents Busy. There is no more off season any more for housing as builders and buyers make up for lost time – Wall Street Journal
- Housing Market Shows Cracks With Price Cuts in Pandemic Boomtowns. In places like Boise, homebuyers are gaining an edge after a real estate frenzy. – Bloomberg
- The Market for Single-Family Rentals Grows as Homeownership Wanes. House hunters are attracted to the hassle-free living and lack of down payments, but there’s a trade-off: They give up the investment of owning a home. – New York Times
- Pelosi tries to salvage housing aid. The White House as of Friday was refusing to go above $150 billion for housing, according to two people familiar with the talks. – Politico
- How Private Equity Landlords are Changing the Housing Market – Cato Institute
- The Economic Burden of Pension Shortfalls: Evidence from House Prices – NBER
- New York Fed Releases White Paper on Effective Eviction Prevention and New Data Collection Efforts Focused on Renters and Landlords – New York Fed
- Why America’s real estate industry is so racist. MacArthur Fellow Keeanga-Yamahtta Taylor writes about how, 53 years after the Fair Housing Act, Black families still face rampant housing discrimination. – Fast Company
- Commercial Real-Estate Sales and Values Surge to Records. Investors hunting for yield gobbled up apartment buildings, life-science labs and industrial properties during the third quarter – Wall Street Journal
- Congress isn’t going to save the housing market. Build Back Better doesn’t build enough. – Vox
On China
- China expands property tax trials in next step of ‘common prosperity’ drive. Xi Jinping backs plan to test levy that could alter country’s economic model – FT
- China’s new property tax may prompt owners of multiple homes to sell down their holdings before prices take a hit, say analysts. – South China Morning Post
- How China Is Rolling Out a Property Tax on Homes, and Why – Bloomberg
- Another Chinese property developer defaults, shares drop – Reuters
- The effect of homeownership on migrant household savings: Evidence from the removal of home purchase restrictions in China – Economic Modelling
On other countries:
- [Germany] In Berlin 85% of people rent their homes — and prices are spiralling. The end of a rental cap and a shortage of stock are making the German capital unaffordable for many – FT
- [Hong Kong] Hong Kong house prices fall by the most in nearly a year as volatile stock market hits buying sentiment – South China Morning Post
- [Italy] Why Americans and Britons Are Rushing to Buy Idyllic Homes in Italy. A range of tax incentives, relatively lower prices and the potential for working remotely is driving up demand from house hunters overseas. – Bloomberg
- [Namibia] How innovative construction could ease Namibia’s housing crisis – World Economic Forum
- [Singapore] The go-go property market doesn’t have legs. Stretched valuations, worsening demographics and policy risks are flashing warning signs – The Straits Times
- [Thailand] Thai central bank eases mortgage rules to support property sector – Reuters
- [United Kingdom] Will the UK embrace long fixed-rate home loans? Lenders have been slow to heed Boris Johnson’s call to action on mortgage terms – FT
On cross-country:
- Do Credit Conditions Move House Prices? – NBER
- Call for Papers: ESCP-TAU-UCLA Conference on Low-Income Housing Supply and Housing Affordability, June 14-16, 2022 – American Real Estate and Urban Economics Association
- Call for Policy Papers on Rethinking Cities for Resilience and Growth in the Post-COVID-19 World – Asian Development Bank Institute
On the US:
- Should You Buy a Home in the US?
Posted by at 5:00 AM
Labels: Global Housing Watch
Subscribe to: Posts