Showing posts with label Global Housing Watch. Show all posts
Friday, April 8, 2022
Housing View – April 8, 2022
On cross-country:
- Global Residential Cities Index – Q4 2021 – Knight Frank
- Understanding African Real Estate Markets – Routledge
- Tighter monetary policy and regulation point to slowdown in property market – ING
On the US:
- Housing Market Expectations – CEPR
- The (Non-)Effect of Opportunity Zones on Housing Prices – Journal of Urban Economics
- The Housing Market Is Hot But Certainly Not ‘Unhinged’. Simple patterns in aggregated numbers provide no understanding as to why buyers are paying more for homes. – Bloomberg
- In Wealthy U.S. Suburbs, There’s Not Much of a Housing Boom. Westchester, NY, and Montgomery County, MD, are up about 1%. Home prices in two-thirds of counties gained over 10%: Attom – Bloomberg
- More Than Shelter: The Effects of Rental Eviction Moratoria on Household Well-Being – Philadelphia Fed
- Where pro-housing groups are emerging – Brookings
- The Effect of Housing First Programs on Future Homelessness and Socioeconomic Outcomes – Kansas Fed
- What Has Research Shown About Alternative Home Financing in the U.S.? A look at the available evidence and the persistent gaps, as well as topics for future investigation – PEW
- Home Prices Can Always Get More Ridiculous. Welcome to the (maybe) new normal. – Bloomberg
- Emergency Rental Assistance Has Helped Stabilize Struggling Renters – Harvard Joint Center for Housing Studies
- US mortgage interest rates hit 5% for the first time in a decade. That’s great news – Quartz
On other countries:
- [Australia] The risks of Australia’s ‘house and holes’ economy are rising. As the country faces an election, it is increasingly reliant on housing and mining for growth – FT
- [Australia] Australia’s Property Market Is Beginning to Cool, Led by Sydney – Bloomberg
- [Canada] Toronto Home Prices Dip as New Listings Close the Gap With Sales – Bloomberg
- [Canada] Canada to Ban Foreigners From Buying Homes as Prices Soar. Trudeau to put billions toward boosting housing supply. Benchmark price is up more than 50% over past two years – Bloomberg
- [Hong Kong] Hong Kong’s property tycoons braced for further losses from zero-Covid regime. Family-run developers forecast to face sharp fall in house prices after steep revenue drops last year – FT
- [Germany] Germany’s Bundesbank warns over bank loans to hot property market – Reuters
- [United Kingdom] UK house prices rise at fastest pace in 18 years. Annual growth hits 14.3% as price-to-earnings ratio reaches all-time high, according to Nationwide survey – FT
- [United Kingdom] UK house prices reach record high in March as supply remains short. Average cost of a property reaches £282,753 driven by strong demand for homes in less dense areas – FT
On cross-country:
- Global Residential Cities Index – Q4 2021 – Knight Frank
- Understanding African Real Estate Markets – Routledge
- Tighter monetary policy and regulation point to slowdown in property market – ING
On the US:
- Housing Market Expectations – CEPR
- The (Non-)Effect of Opportunity Zones on Housing Prices – Journal of Urban Economics
- The Housing Market Is Hot But Certainly Not ‘Unhinged’.
Posted by at 5:00 AM
Labels: Global Housing Watch
Monday, April 4, 2022
Housing Market Expectations
From a new NBER working paper by Theresa Kuchler, Monika Piazzesi, and Johannes Stroebel:
“We review the recent literature on the determinants and effects of housing market expectations. We begin by providing an overview of existing surveys that elicit housing market expectations, and discuss how those surveys may be expanded in the future. We then document a number of facts about time-series and cross-sectional patterns of housing market expectations in these survey data, before summarizing research that has studied how individuals form these expectations. Housing market expectations are strongly influenced by recently observed house price changes, by personally or locally observed house price changes, by house price changes observed in a person’s social network, and by current home ownership status. Similarly, experienced house price volatility affects expectations uncertainty. We also summarize recent work that documents how differences in housing market expectations translate into differences in individuals’ housing market behaviors, including their home purchasing and mortgage financing decisions. Finally, we highlight research on how expectations affect aggregate outcomes in the housing market.”
From a new NBER working paper by Theresa Kuchler, Monika Piazzesi, and Johannes Stroebel:
“We review the recent literature on the determinants and effects of housing market expectations. We begin by providing an overview of existing surveys that elicit housing market expectations, and discuss how those surveys may be expanded in the future. We then document a number of facts about time-series and cross-sectional patterns of housing market expectations in these survey data,
Posted by at 4:32 AM
Labels: Global Housing Watch
What Drives Mortgage Default Risk in Europe and the U.S.?
From a new IMF working paper by Marco Gross, Thierry Tressel, Xiaodan Ding, and Eugen Tereanu:
“We present an analysis of the sensitivity of household mortgage probabilities of default (PDs) and loss given default (LGDs) on unemployment rates, house price growth, interest rates, and other drivers. A structural micro-macro simulation model is used to that end. It is anchored in the balance sheets and income-expense flow data from about 95,000 households and 230,000 household members from 21 EU countries and the U.S. We present country-specific nonlinear regressions based on the structural model simulation-implied relation between PDs and LGDs and their drivers. These can be used for macro scenario-conditional forecasting, without requiring the conduct of the micro simulation. We also present a policy counterfactual analysis of the responsiveness of mortgage PDs, LGDs, and bank capitalization conditional on adverse scenarios related to the COVID-19 pandemic across all countries. The economics of debt moratoria and guarantees are discussed against the background of the model-based analysis.”
From a new IMF working paper by Marco Gross, Thierry Tressel, Xiaodan Ding, and Eugen Tereanu:
“We present an analysis of the sensitivity of household mortgage probabilities of default (PDs) and loss given default (LGDs) on unemployment rates, house price growth, interest rates, and other drivers. A structural micro-macro simulation model is used to that end. It is anchored in the balance sheets and income-expense flow data from about 95,000 households and 230,000 household members from 21 EU countries and the U.S.
Posted by at 4:30 AM
Labels: Global Housing Watch
Friday, April 1, 2022
Housing View – April 1, 2022
On cross-country:
- Nevertheless, They Persist: Cross-Country Differences in Homeownership Behavior – SSRN
- Here are five policies to help solve the global housing crisis – World Economic Forum
- Residential Real Estate in a Volatile World – Barry Ritholtz
On the US:
- Real-Time Market Monitoring Finds Signs of Brewing U.S. Housing Bubble – Dallas Fed and Bloomberg
- Can Home Prices and Interest Rates Soar at the Same Time? Rising mortgage rates are supposed to cool house prices. But this time could be different. – New York Times
- Faulty evidence and misdiagnosed solutions. Why centralizing appraisal standards and criteria under a new federal agency as proposed under the Fair Appraisal and Inequity Reform Act is not justified – AEI
- Rising Interest Rates Will Shift Housing’s Foundations. Some might be locked into homes they already own while new buyers opt for smaller homes in cheaper places – Wall Street Journal
- The Housing Boom Is Even Rewarding People Who Don’t Go Anywhere – Bloomberg
- Homeowners Spin Soaring Prices Into U.S. Real Estate Riches. Cash-out refis enable newbie investors to buy second or third houses— or more — to capitalize on surging rental demand. – Bloomberg
- Residential inflation: The rise in the pipeline – VoxEU
- A Wasted Opportunity to Improve Housing Outcomes for Minorities. If the government sets home prices, it could have catastrophic consequences. – Wall Street Journal
- Nashville’s chart-topping house prices. Southern charm, a growing tech scene and low taxes draw ‘transplants’ to the country music capital – FT
- White House requests big HUD boost for housing supply – Politico
On other countries:
- [Canada] Canada’s red-hot housing markets hint at cooldown as higher rates, inflation bite – Reuters
- [Canada] The divide between housing haves and have-nots is growing – will a politician exploit it? – Globe and Mail
- [Canada] Ontario bill aims to speed construction as house prices keep surging – Globe and Mail
- [Canada] Canadian house prices rising strongly despite pandemic – Global Property Guide
- [Canada] Foreign Buyers’ Tax Just Might Cool Ontario’s Hot Housing Market. Rising rates and levies pushed prices down five years ago. Ontario is epicenter of real estate affordability crisis – Bloomberg
- [Germany] Germany’s Favorite Hedge Against Inflation? Real Estate. Inflation worries are pushing German house prices even higher, adding to the risk of an overshoot. – Bloomberg
- [Netherlands] The Netherlands’ house price boom continues strong – Global Property Guide
- [Netherlands] Netherlands: house prices to rise more slowly in 2022 – ING
- [Norway] Norway’s modest house price rises – Global Property Guide
- [Romania] Romania’s house price growth accelerating – Global Property Guide
- [Switzerland] Swiss National Bank says monetary policy not way to curb real estate risks – Reuters
- [Switzerland] Switzerland’s house prices stable – Global Property Guide
- [Taiwan] Taiwan’s housing market growing stronger – Global Property Guide
- [Vietnam] Vietnam’s housing market gathering pace – Global Property Guide
On cross-country:
- Nevertheless, They Persist: Cross-Country Differences in Homeownership Behavior – SSRN
- Here are five policies to help solve the global housing crisis – World Economic Forum
- Residential Real Estate in a Volatile World – Barry Ritholtz
On the US:
- Real-Time Market Monitoring Finds Signs of Brewing U.S. Housing Bubble – Dallas Fed and Bloomberg
- Can Home Prices and Interest Rates Soar at the Same Time?
Posted by at 5:00 AM
Labels: Global Housing Watch
Tuesday, March 29, 2022
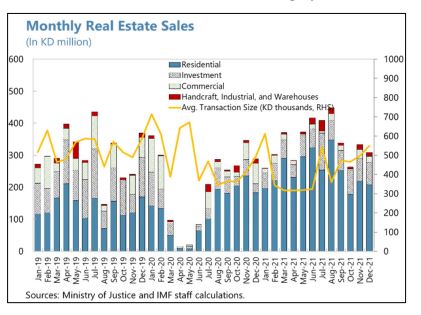
Housing Market in Kuwait
From the IMF’s latest report on Kuwait:
“The residential real estate market quickly recovered, but investment and commercial real estate continue to lag. The value of real estate transactions stalled at the onset of the pandemic but strongly recovered thereafter, driven by favorable financing conditions. Residential sales recovered faster than investment and commercial components, which lag in the volume and value of transactions. Average transaction value has been volatile but trending up in recent months.”
Posted by at 5:28 PM
Labels: Global Housing Watch
Subscribe to: Posts