Sunday, September 17, 2017
Global House Prices: An Update
Global Housing Watch Newsletter: September 2017
In this interview, Kate Everett-Allen talks about Knight Frank’s dataset on global house prices. She also talks about the state of global house prices at the national level, city level, and at prime residential level. Kate Everett-Allen is a Partner at Knight Frank, and specializes in residential research.
House prices across countries…
Hites Ahir: Why and in what way does Knight Frank track global house prices?
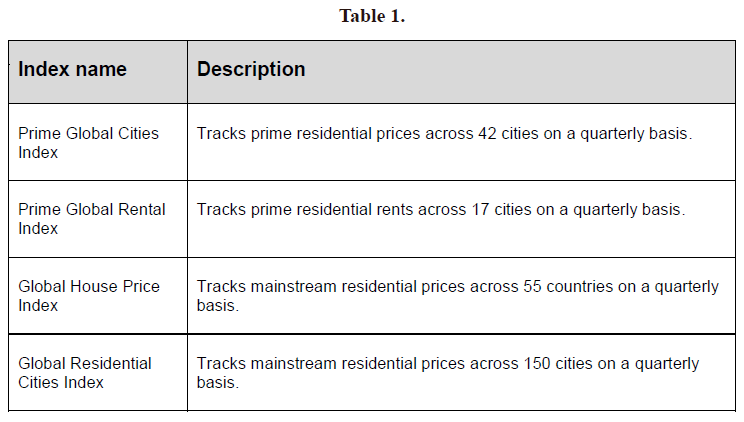
Kate Everett-Allen: We have been monitoring house price movements for the last decade in order to meet the needs of our clients who want to gauge market performance on a like-for-like basis. With this in mind, we have developed four residential indices that track both mainstream, and prime prices, and rents at a country, and city level.
Hites Ahir: What does the latest reading of Knight Frank’s Global House Price Index show?
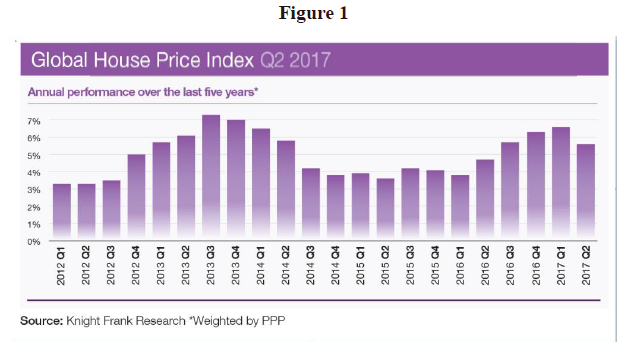
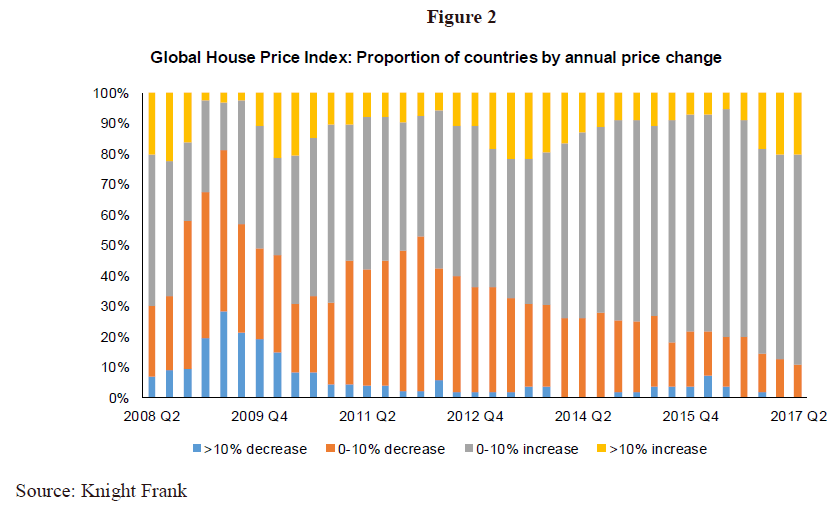
Kate Everett-Allen: Our latest Global House Price Index, which tracks the movement in average house prices across 55 countries worldwide, shows the extent to which housing markets have recovered from the global financial crisis. Following Lehman Brothers’ collapse in 2008, 42 percent of the countries in our index recorded positive annual growth, in Q2 2017 this figure has accelerated to 89 percent.
That is not to say there are no headwinds. The latest edition of our index, which covers the year to Q2 2017, saw the index’s overall rate of annual growth decline for the first time since Q4 2015. As policymakers step away from economic stimulus (UK, US, Japan), Brexit negotiations dominate the UK and European landscape and geopolitical tensions persist across multiple continents (N Korea, Middle East, Ukraine) there are signs this is filtering through to buyer and investor sentiment.
Hites Ahir: In terms of momentum, are we seeing more countries with higher house price growth?
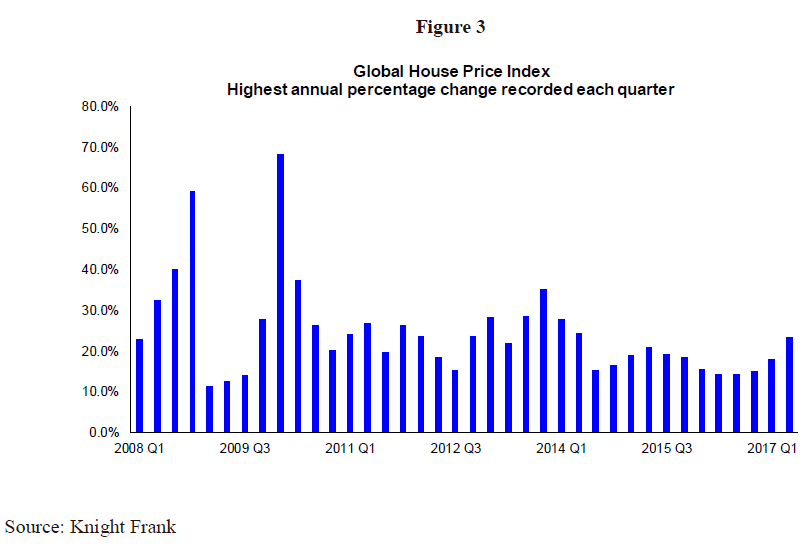
Kate Everett-Allen: Eleven of the 55 countries tracked by our index recorded double-digit annual price growth in the year to June 2017, the last time this figure was exceeded was in Q3 2013. The uptick occurred in Q4 2016 with countries such as Iceland, New Zealand, Canada and Turkey all performing strongly.
Extracting the highest-ranking annual percentage change recorded each quarter provides further evidence of this trend with a slight uptick evident in the last two quarters.
House prices across cities…
Hites Ahir: You have also collected house price data at the city level. What does the latest reading of Knight Frank’s Global Residential Cities Index show?
Kate Everett-Allen: The Global Residential Cities Index, which tracks average house prices across 150 cities worldwide, has risen for four consecutive quarters.
The latest edition, covering the 12 months to Q1 2017, highlights the outperformance of China’s first tier cities. Seven of our top ten rankings are occupied by Chinese cities, with Wuxi (31.7 percent) and Nanjing (28.8 percent), each home to a population of over 6 million, occupying the highest rankings.
Toronto (24.8 percent) sits in fourth place, however, with the introduction of a new homebuyer tax in March this year, we expect price growth to moderate, mirroring the trend seen in Vancouver (12.2 percent).
In Europe, the Norwegian capital, Oslo (21 percent), and the four largest Dutch cities – all recording annual growth in excess of 10 percent – are emerging as key centers of growth.
Hites Ahir: Could you tell us a bit about the house price developments at the city level for China vs. the United States?
Kate Everett-Allen: The index tracks twenty cities in both countries. On average residential prices across the US cities increased by 6.4 percent in the year to June 2017, whilst Chinese cities recorded a 15.9 percent rise.
However, analysis of price changes over a three-month period casts a different light. The average price of a property in the US cities rose 2.2 percent between March and June this year, whilst Chinese cities mustered only a 0.7 percent uplift.
These figures suggest the latest round of cooling measures introduced across Chinese cities, which range from higher mortgage down payments to limits on second home purchases and quotas on new home sales, are influencing market performance.
Luxury residential prices across cities…
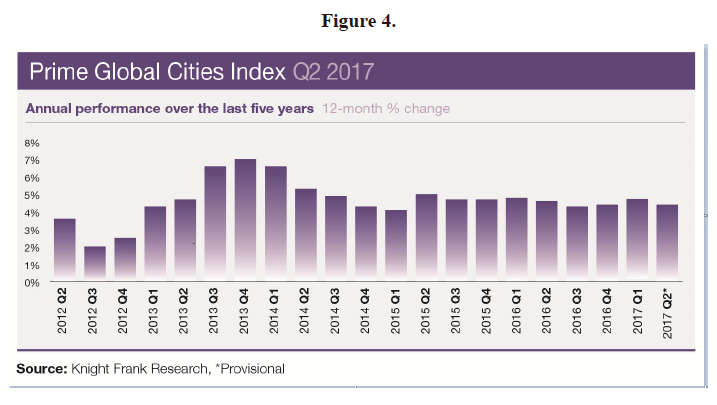
Hites Ahir: What does the latest reading of Knight Frank’s Prime Global Cities Index show?
Kate Everett-Allen: Our Prime Global Cities Index, which tracks luxury prices across more than 40 cities, shows less volatility than our average residential price indices. The rate of price growth recorded by our Prime Global Cities Index has been largely static since 2014, registering an uplift of between 4 percent and 5 percent year-on-year for the last 12 quarters.
Asian cities are well-represented at the top of our latest annual rankings with Guangzhou (35.6 percent), Seoul (20.7 percent), Shanghai (19.9 percent), Beijing (15.0 percent), Sydney (11.5 percent) and Melbourne (9.1 percent) all sat within the top ten.
Hites Ahir: How is economic and political uncertainty affecting prime property market?
Kate Everett-Allen: Slow economic growth has influenced markets such as Tokyo (-2.8 percent) and Moscow (-11.8 percent) in the last year where GDP growth has declined, oil prices slipped and currencies weakened.
Conversely, economic uncertainty has strengthened safe haven capital flows into other luxury property markets such as Berlin, Madrid and Paris from markets such as Turkey, Venezuela and the Middle East prompted by political or security concerns.
This movement of wealth, particularly where it occurs on a large scale, is sparking the attention of policymakers (Toronto, London, Sydney) keen to curb price inflation by deterring speculative investment via foreign buyer taxes or stamp duty hikes.
Hites Ahir: How does prime residential prices compare in financial cities, tech cities, and other cities?
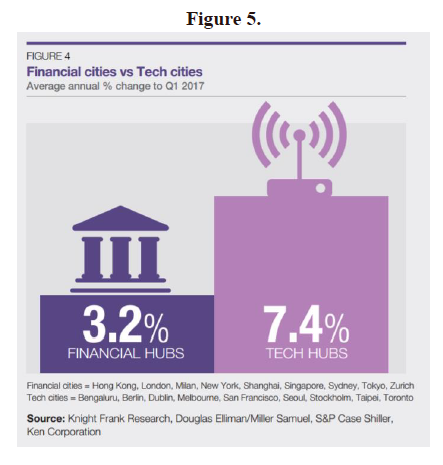
Kate Everett-Allen: In the Q1 2017 edition of our Prime Global Cities Index we compared the price performance of established financial cities such as London, New York, Hong Kong against emerging technology hubs such as Berlin, San Francisco, Stockholm.
Perhaps unsurprisingly, the vibrant technology hubs that are attracting new pools of creative talent, but where new supply has yet to catch up with demand, came out on top. Here, prime prices recorded a 7.4 percent rise year-on-year, compared with a 3.2 percent rise for the world’s top financial capitals over the same period.
For more information on any of the indices please contact Kate Everett-Allen or visit www.knightfrank.com/research
Posted by at 6:00 PM
Labels: Global Housing Watch
Subscribe to: Posts