Monday, September 3, 2012
Global House Price Watch

This document draws on “Global Housing Cycles”, an IMF Working Paper 12/217 by Deniz Igan and Prakash Loungani (http://www.imf.org/external/pubs/cat/longres.aspx?sk=26229.0). It updates a few of the charts from that paper. As with Working Papers, the views expressed in this document are those of the authors and do not necessarily represent those of the IMF or IMF policy.
The Global House Price
Roller Coaster
Roller Coaster
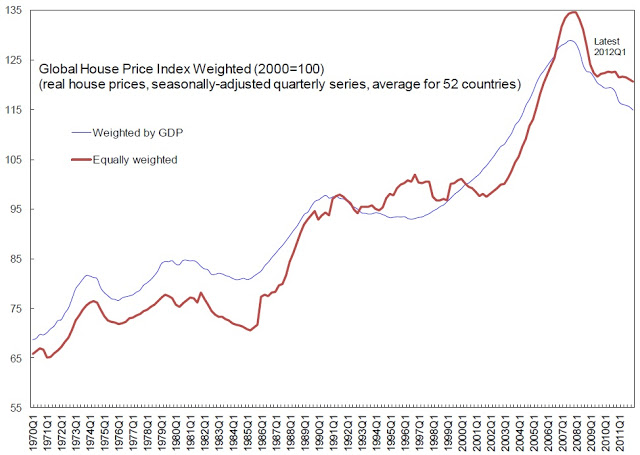
Our global index of house prices—a
weighted average of price in 52 countries—shows no sign of an uptick. The
equally-weighted index moved sideways during the first quarter of 2012 and the
GDP-weighted index continued to decline (see Chart 1).
weighted average of price in 52 countries—shows no sign of an uptick. The
equally-weighted index moved sideways during the first quarter of 2012 and the
GDP-weighted index continued to decline (see Chart 1).
Chart 1. Global House Price Index
Up or Down?
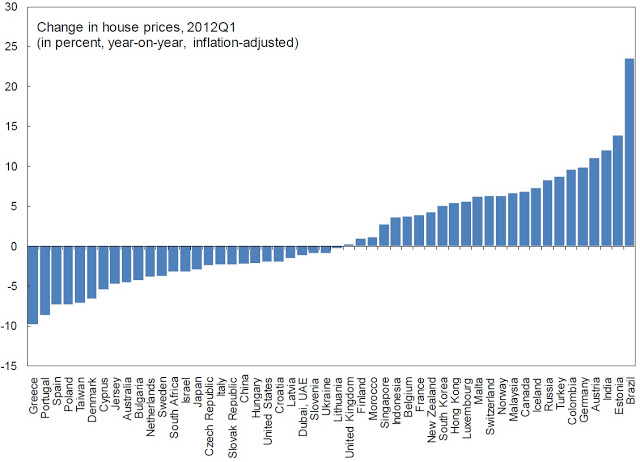
The global index continued to
mask very different developments across countries. House prices have fallen
over the past year in just over half of the countries and risen in the rest, in
Asian countries in particular (see Chart 2).
The global index continued to
mask very different developments across countries. House prices have fallen
over the past year in just over half of the countries and risen in the rest, in
Asian countries in particular (see Chart 2).
Chart 2. House Prices around the World
Hold on tight
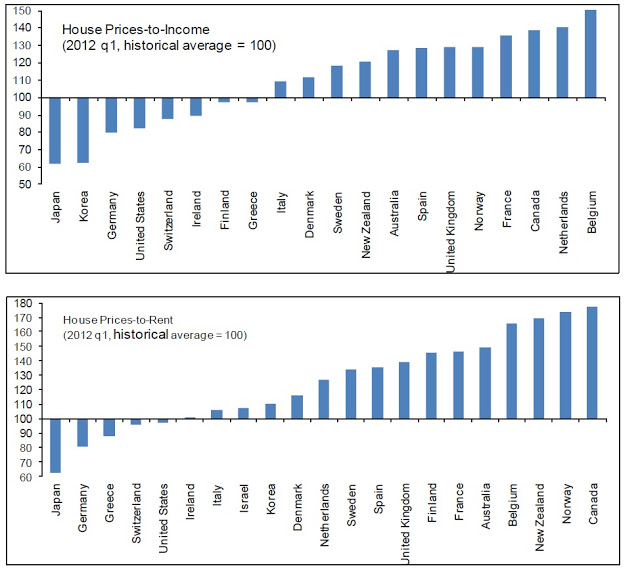
The ratio of house prices to
income and the ratio of house prices to rents are two indicators that give a
sense whether prices are likely to decline or rise. The price to income ratio
is the basic affordability measure for housing in a given area and the price to
rent ratio compares the total costs of homeownership vs. the cost of renting a
similar property. If these ratios are above their historical averages, economic
theory suggests that the house prices may decline in the future. The latest
data shows that both ratios continue to remain above—and in many cases well
above—their historical averages, signaling that there may potential for
corrections still to come (see Chart 3).
Chart 3. House Prices
Relative to Incomes & Rents:
Relative to Incomes & Rents:
Current Ratios Compared
With Historical Averages
With Historical Averages
Driving factors
An econometric model of the
determinants of house prices, used in the working paper by Igan and Loungani explains
house price growth based on several short-run factors, such as growth in
incomes, asset prices, and population, and long-run-factors, such as the ratio
of house prices to incomes. The difference between house prices and those
predicted on the basis of these fundamental factors gives another indication of
whether prices may have more room to fall.
The results from this
exercise show that in many countries the declines in house prices over the past
five years (the ‘actual’) are close to, or even exceed, what was predicted by
the model. But for many countries, house prices are still resisting the
predictions of the model (see Chart 4).
exercise show that in many countries the declines in house prices over the past
five years (the ‘actual’) are close to, or even exceed, what was predicted by
the model. But for many countries, house prices are still resisting the
predictions of the model (see Chart 4).
Chart 4. House Prices Changes Compared With Predictions from an Econometric Model

“Location, Location, Location”: A Closer Look within
the United States
the United States
With house prices falling substantially over the past few
years, housing affordability improved in most U.S. states last year. In most
U.S. states, a family making the median income for the state could afford the
median house (Chart 5). There were still a few states, along the coasts, where
the median house still remained out of reach of the median household. A similar
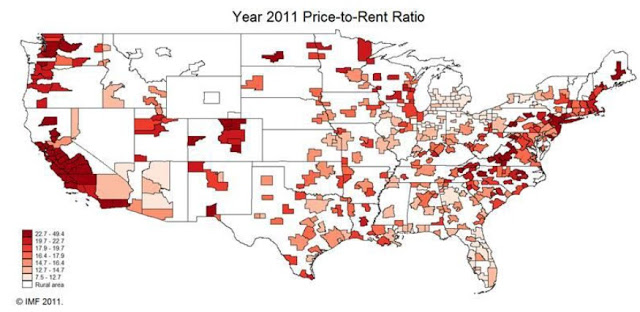
picture emerges when looking at price-to-rent ratios by metropolitan areas:
house prices remained out of line with rents in some areas along the coasts
(see Chart 6).
years, housing affordability improved in most U.S. states last year. In most
U.S. states, a family making the median income for the state could afford the
median house (Chart 5). There were still a few states, along the coasts, where
the median house still remained out of reach of the median household. A similar
picture emerges when looking at price-to-rent ratios by metropolitan areas:
house prices remained out of line with rents in some areas along the coasts
(see Chart 6).
Chart 5. United States: House Price Affordability by State
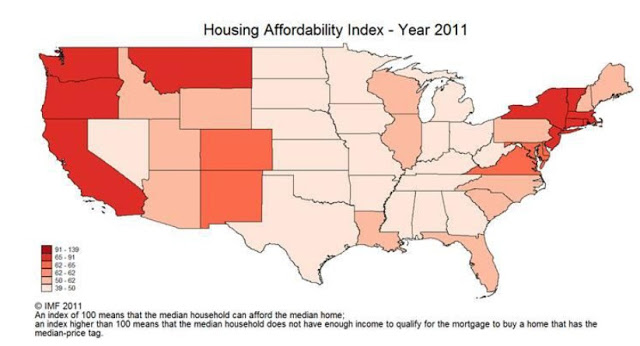
Figure 6. United States: Price to Rent Ratios by Metropolitan Areas
Recent IMF staff
studies
studies
As part of its regular
monitoring of economic conditions in countries (the so-called “Article IV”
reports), the IMF staff often provides an assessment of conditions in the
housing markets. Readers are encouraged to complement the broad-brush analysis
in this document with the country-focused assessment provided in those reports.
A list of some of the countries for which housing markets were described in
recent reports is given below.
|
Housing Markets in Recent IMF Staff Reports
|
Date of Report
|
|
|
Link to:
|
||
|
Discussion of housing markets
|
Full report (pages on which housing is discussed)
|
|
|
Germany
|
Jul-12
|
|
|
Mar-12
|
||
|
Feb-12
|
||
|
Feb-12
|
||
|
Mar-12
|
||
|
Aug-12
|
||
|
Jun-12
|
||
|
May-12
|
||
|
Aug-12
|
||

Posted by at 11:22 AM
Labels: Global Housing Watch
Subscribe to: Posts