


Tuesday, March 20, 2018
A housing recovery without homeowners
From Federal Reserve Bank of St. Louis:
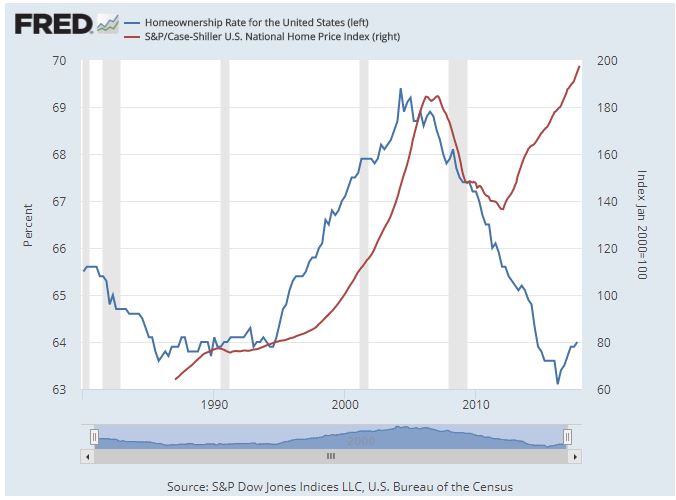
“Historically, the cost of buying a house has been positively correlated with the percent of households that own their home. During 1996 to 2006 in the United States, both the price of houses and the homeownership rate increased. This increasing trend ended abruptly with the global financial crisis, which saw house prices plunge and drove homeownership rates to historically low levels. If homeownership became less attractive in the wake of the financial crisis, we might expect both prices and homeownership to decrease. Similarly, if the current increase in house prices were driven by people buying homes to live in, we might expect the homeownership rate to increase along with prices. However, recent evidence shows that house prices and homeownership are diverging.
The graph shows that, in the wake of the financial crisis, house prices declined by over 25 percent, from an index value of around 180 to around 135. The homeownership rate also dropped from a high of over 69 percent to just over 63 percent, its lowest level since 1980. Unlike in the past, the homeownership rate continued to fall even after house prices began to recover.
Several factors could be driving the decoupling of house prices and the homeownership rate. From the housing supply side, there is a trend toward decreased construction of starter and mid-size housing units. Developers have increased the construction of large single-family homes at the expense of other segments in the market. This limited supply, particularly for starter homes, could result in increased prices for those homes and fewer new homeowners.”
Continue reading here.
From Federal Reserve Bank of St. Louis:
“Historically, the cost of buying a house has been positively correlated with the percent of households that own their home. During 1996 to 2006 in the United States, both the price of houses and the homeownership rate increased. This increasing trend ended abruptly with the global financial crisis, which saw house prices plunge and drove homeownership rates to historically low levels.
Posted by at 5:00 AM
Labels: Global Housing Watch
Monday, March 19, 2018
House Prices in Nambia
The IMF’s latest report on Namibia says that:
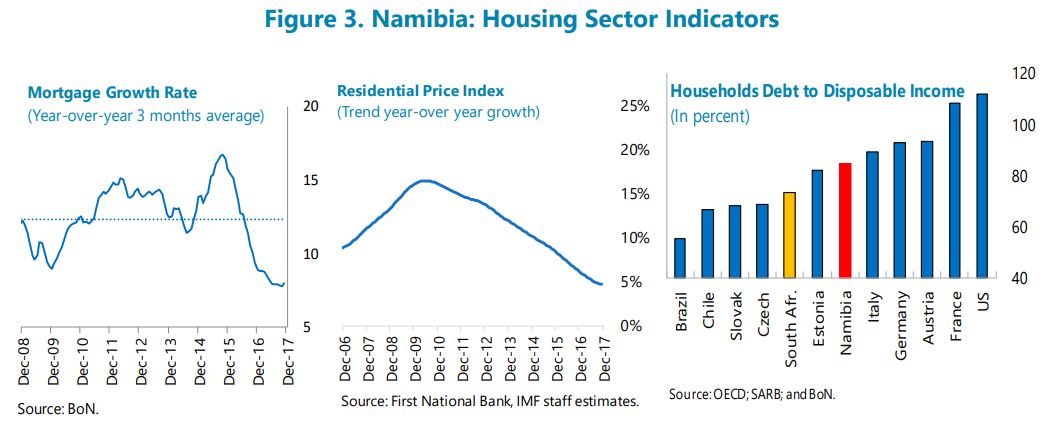
“The rapid rise in housing prices and household debt, banks’ large exposure to mortgages, and banks reliance on wholesale funding are sources of concern. A major decline in real estate prices would adversely affect bank capital and profitability.”
The IMF’s latest report on Namibia says that:
“The rapid rise in housing prices and household debt, banks’ large exposure to mortgages, and banks reliance on wholesale funding are sources of concern. A major decline in real estate prices would adversely affect bank capital and profitability.”
Posted by at 11:21 AM
Labels: Global Housing Watch
Creative Destruction, the Uber Effect, and the Slow Death of the NYC Taxi Cartel
HT: Carpe Diem. From the article “This Chart Shows the Slow Death of the NYC Yellow Taxi” by Nick Lucchesi:
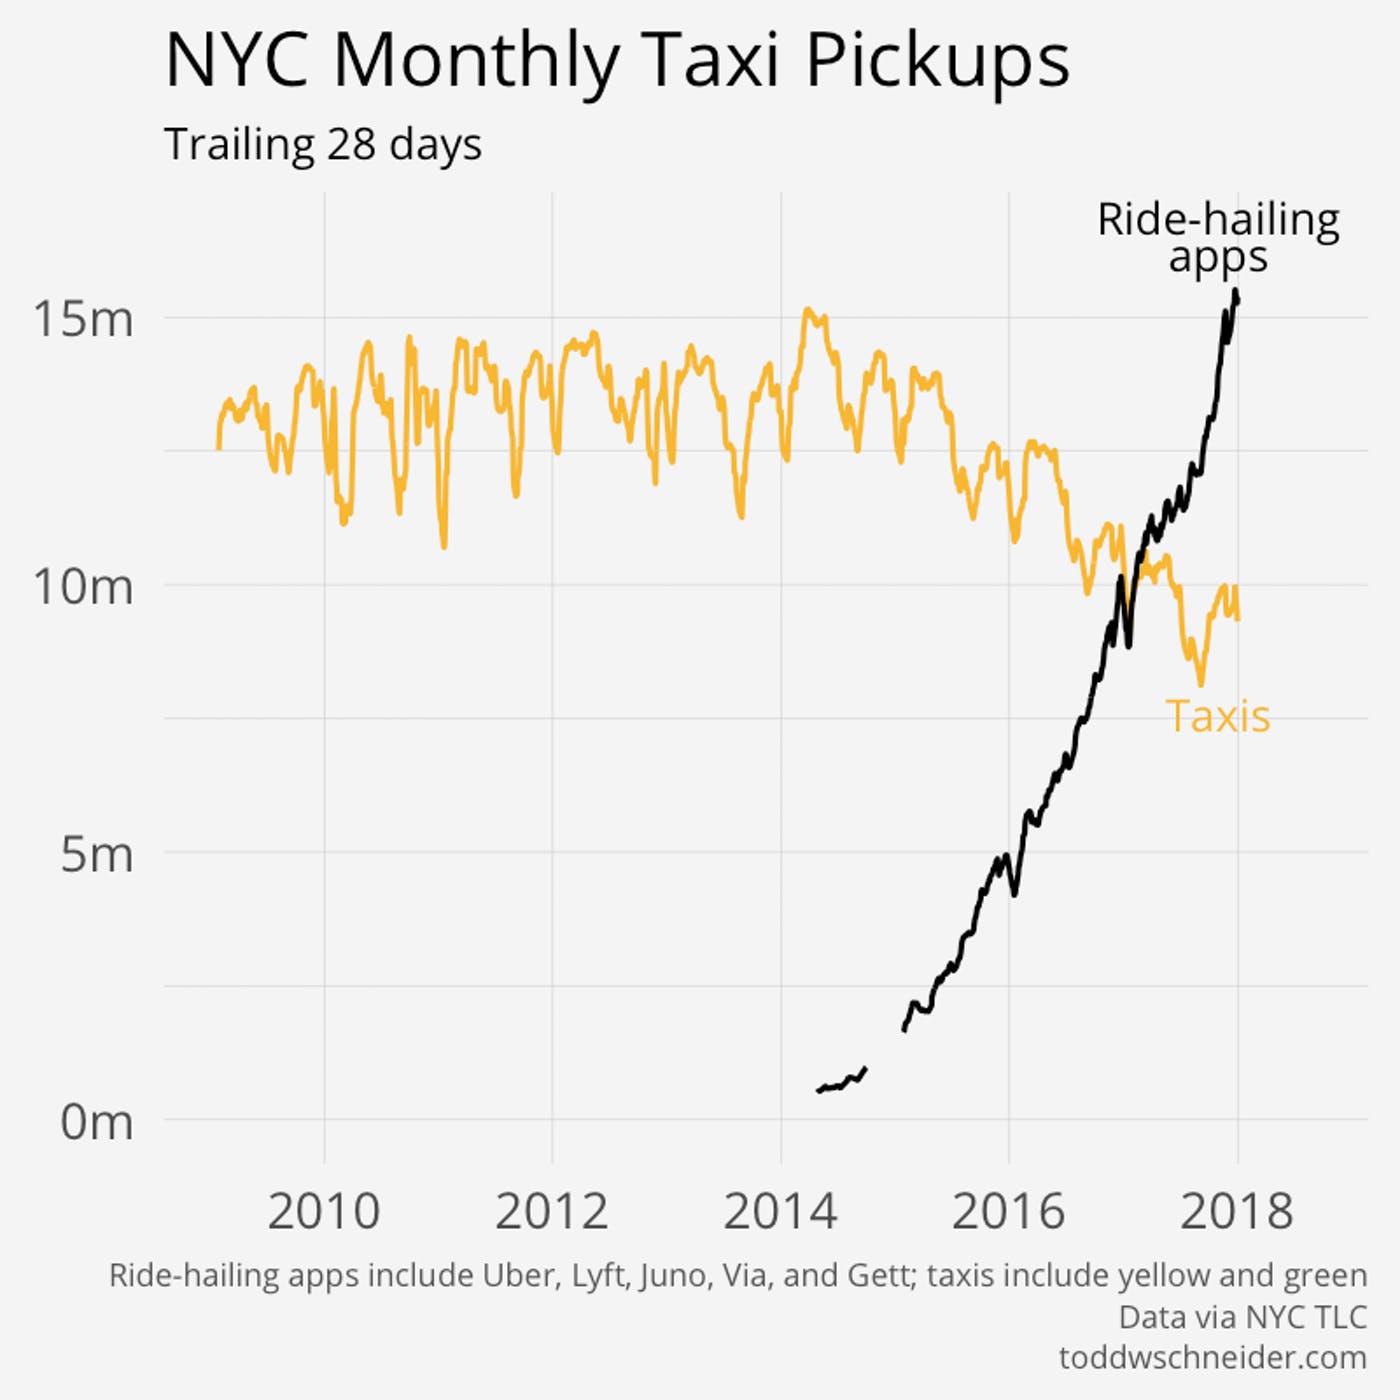
“A new chart released this week shows that the New York City taxi cab is not only an endangered species but that its days are numbered. Today, there are 65 percent more ride-hailing trips than taxi trips in New York City (see chart above).
Genius employee and data-visual enthusiast Todd Schneider pulled from the reams of data released by the New York City Taxi & Limousine Commission each month that shows fares by car type — taxi or ride-hailing service. His analysis shows the tide has turned: At the end of 2017, all monthly ride-hailing pickups (Uber, Lyft, Juno, Via, Gett) numbered 15 million, while taxi pickups numbered less than 10 million. As use of yellow taxis (which primarily serve Manhattan) and green taxis (which primarily serve the other four boroughs) has been on the decline, there’s been a sharp increase in the use of ride-hailing apps.
The chart above shows the data behind one of the most dramatic changes in America’s largest city over the past five years. The way people in New York (tourists and locals alike) get around has flipped, and it doesn’t show any sign of stopping, according to Schneider’s analysis.”
HT: Carpe Diem. From the article “This Chart Shows the Slow Death of the NYC Yellow Taxi” by Nick Lucchesi:
“A new chart released this week shows that the New York City taxi cab is not only an endangered species but that its days are numbered. Today, there are 65 percent more ride-hailing trips than taxi trips in New York City (see chart above).
Genius employee and data-visual enthusiast Todd Schneider pulled from the reams of data released by the New York City Taxi &
Posted by at 10:18 AM
Labels: Macro Demystified
Friday, March 16, 2018
Housing View – March 16, 2018
On cross-country:
- Mortgages, developers and property prices – Bank for International Settlements
- FT Special Report on Property Market – Financial Times
- The US homeownership rate has lost ground compared with other developed countries – Urban Institute
On the US:
- It All Adds Up: The Cost of Housing Development Fees in Seven California Cities – Terner Center for Housing Innovation (UC Berkely)
- “Sand castles before the tide”: How can America’s most expensive cities keep themselves affordable? – American Economic Association
- Student Debt vs. Homeownership – Federal Reserve Bank of Richmond
- Rising Mortgage Rates Threaten Housing Affordability and Inventory – Zillow
- The Trump Administration’s War on New Housing – Citylab
- Black homeownership rates haven’t changed much in the 50 years since the Fair Housing Act – Curbed
- With Some Homeownership Incentives Gone, Will More Americans Actually Rent? – Governing
- White Flight’ Persists in America’s Suburbs – Citylab
- Want Affordable Housing? Just Build More of It – Bloomberg
- Panel Discussion Explores Potential for Small Unit Housing in New York City – NYU Furman Center
- First-Time Homebuyer Counseling and the Mortgage Selection Experience in the United States: Evidence from the National Survey of Mortgage Originations – Federal Housing Finance Agency
- Mortgage Experiences of Rural Borrowers in the United States: Insights from the National Survey of Mortgage Originations – Federal Housing Finance Agency
On other countries:
- [Australia] The Effect of Zoning on Housing Prices – Reserve Bank of Australia
- [Australia] The Distribution of Mortgage Rates – Reserve Bank of Australia
- [Australia] Making Better Economic Cases For Housing Policies – University of New South Wales
- [Belgium] Housing Market in Belgium – IMF
- [Canada] Vancouver’s empty-homes tax might not affect as many homeowners as predicted – The Globe and Mail
- [Malaysia] Housing Market in Malaysia – IMF
- [Netherlands] Gentrification through the sale of rental housing? Evidence from Amsterdam – EconPapers
- [New Zealand] Getting the best out of macro-prudential policy – Reserve Bank of New Zealand
- [Portugal] Increasing number of foreigners snap up beachside homes in Portugal – Global Property Guide
- [Sweden] Sweden Responds to Worst Housing Slump Since 2008 With Supply – Bloomberg
- [United Arab Emirates] Dubai: Come Undone – REIDIN
- [United Kingdom] Housing Crisis: Big Speeches, Small Steps – New Economics Foundation

Photo by Aliis Sinisalu
On cross-country:
- Mortgages, developers and property prices – Bank for International Settlements
- FT Special Report on Property Market – Financial Times
- The US homeownership rate has lost ground compared with other developed countries – Urban Institute
On the US:
- It All Adds Up: The Cost of Housing Development Fees in Seven California Cities – Terner Center for Housing Innovation (UC Berkely)
- “Sand castles before the tide”: How can America’s most expensive cities keep themselves affordable?
Posted by at 5:00 AM
Labels: Global Housing Watch
Wednesday, March 14, 2018
The Distributional Effects of Government Spending Shocks in Developing Economies
From my latest IMF working paper with Davide Furceri, Jun Ge, and Giovanni Melina:
“We construct unanticipated government spending shocks for 103 developing countries from 1990 to 2015 and study their effects on income distribution. We find that unanticipated fiscal consolidations lead to a long-lasting increase in income inequality, while fiscal expansions lower inequality. The results are robust to several measures of income distribution and size of the fiscal shocks, to an alternative identification strategy, across expansions and recessions and across country groups (low-income countries versus emerging markets). An additional contribution of the paper is the computation of the medium-term inequality multiplier. This is on average about 1 in our sample, meaning that a cumulative decrease in government spending of 1 percent of GDP over 5 years is associated with a cumulative increase in the Gini coefficient over the same period of about 1 percentage point. The multiplier is larger for total government expenditure than for public investment and consumption (with the former having larger effect), likely due to the redistributive role of transfers. Finally, we find that (unanticipated) fiscal consolidations lead to an increase in poverty.”
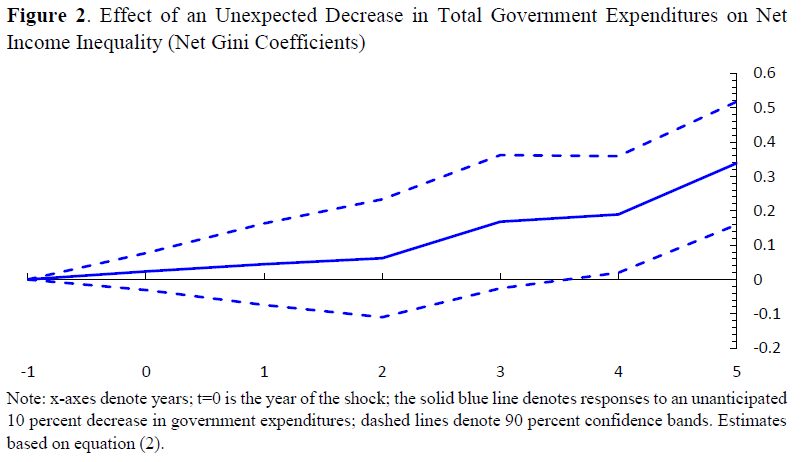
From my latest IMF working paper with Davide Furceri, Jun Ge, and Giovanni Melina:
“We construct unanticipated government spending shocks for 103 developing countries from 1990 to 2015 and study their effects on income distribution. We find that unanticipated fiscal consolidations lead to a long-lasting increase in income inequality, while fiscal expansions lower inequality. The results are robust to several measures of income distribution and size of the fiscal shocks,
Posted by at 4:52 PM
Labels: Inclusive Growth
Subscribe to: Posts